App Templates Analytics page provides detailed insights about your app template campaigns, and helps you get a better understanding of your campaign strategies.
On this page, you can see overall metrics for all of your app template campaigns. You can narrow down the campaigns to see more related data. You can also see the results of your campaigns with or without control groups on the same page, and compare them.
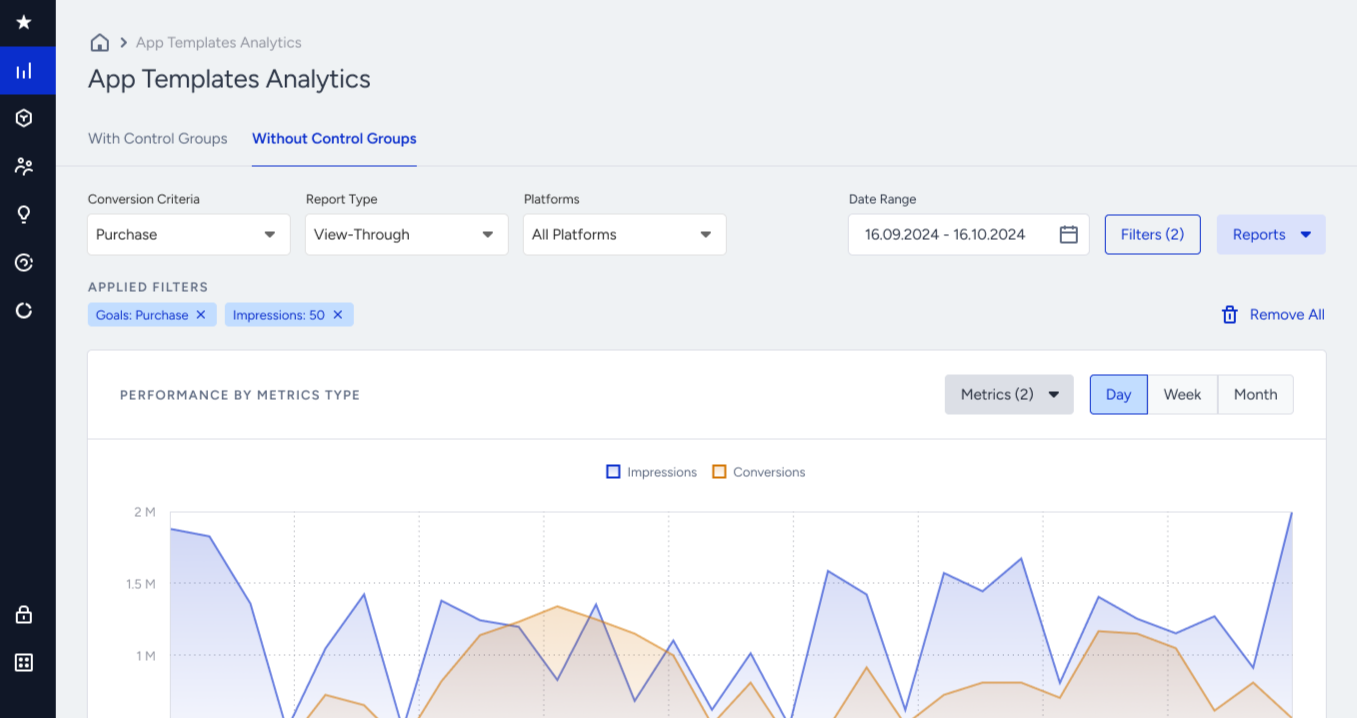
The analytics dashboard consists of 5 sections: Pre-filters, Filters, Graphs, and Campaigns Table.
Pre-filters
You can apply With/Without Control Groups, Conversion Criteria, Report Type, Platform, and Date Range pre-filters to your data to see the related insights. Each filter will have a default selected option. You can change these preferences to view the respective data.
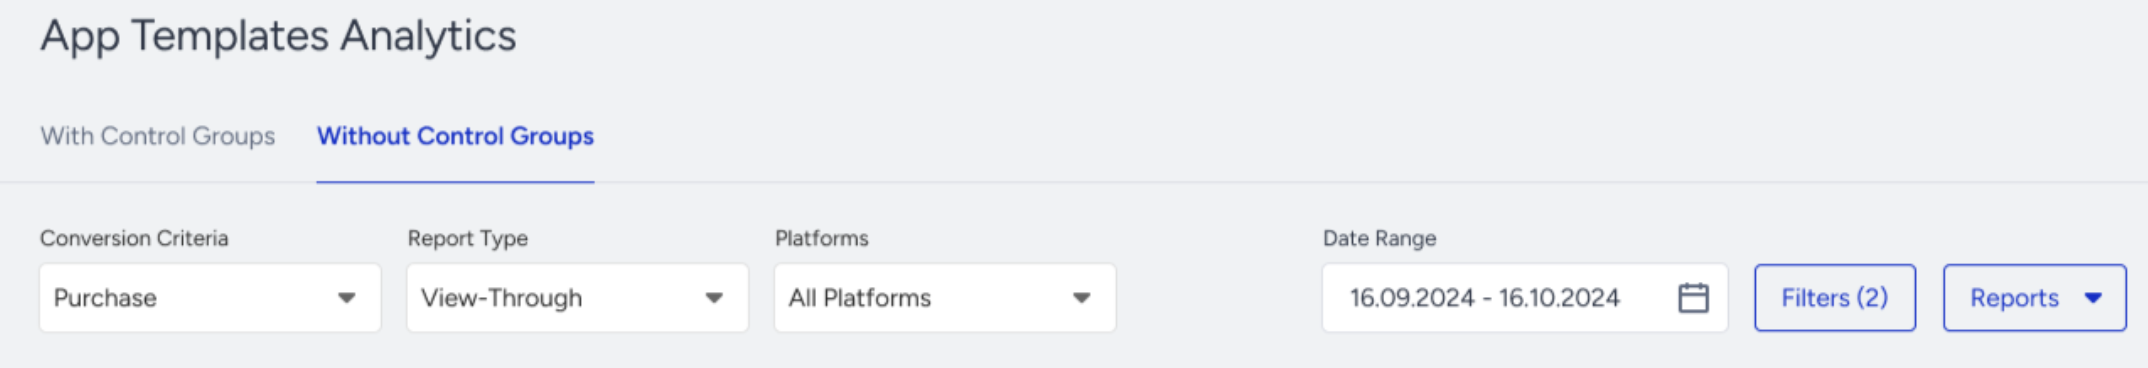
With/Without Control Groups
These options help you view the metrics for your campaigns with or without control groups. The With Control Groups tab displays the campaigns that have control groups with more than 0% traffic allocation while the Without Control Groups tab displays those with no control group distribution. Each tab has their own unique metrics.
Conversion Criteria
Conversion Criteria is the event that lets you calculate your conversions. The campaigns that do not have the selected event as a campaign goal will not be listed as their conversion automatically becomes zero for the selected event.
Report Type
You can view your report as view-through or click-through.
Platform
You can see 3 platform options: All Platforms, iOS, and Android. You can see the results according to the device platform types.
Date Range
You can select specific date ranges to view your data. When you select a time range, campaigns that have metrics for the selected range and contribute to the metrics overall are listed on the dashboard.
Filters
You can apply different types of filters to view only a selected group of campaigns.
To apply filters, click the Filters button on the right of the page to see the filters modal.
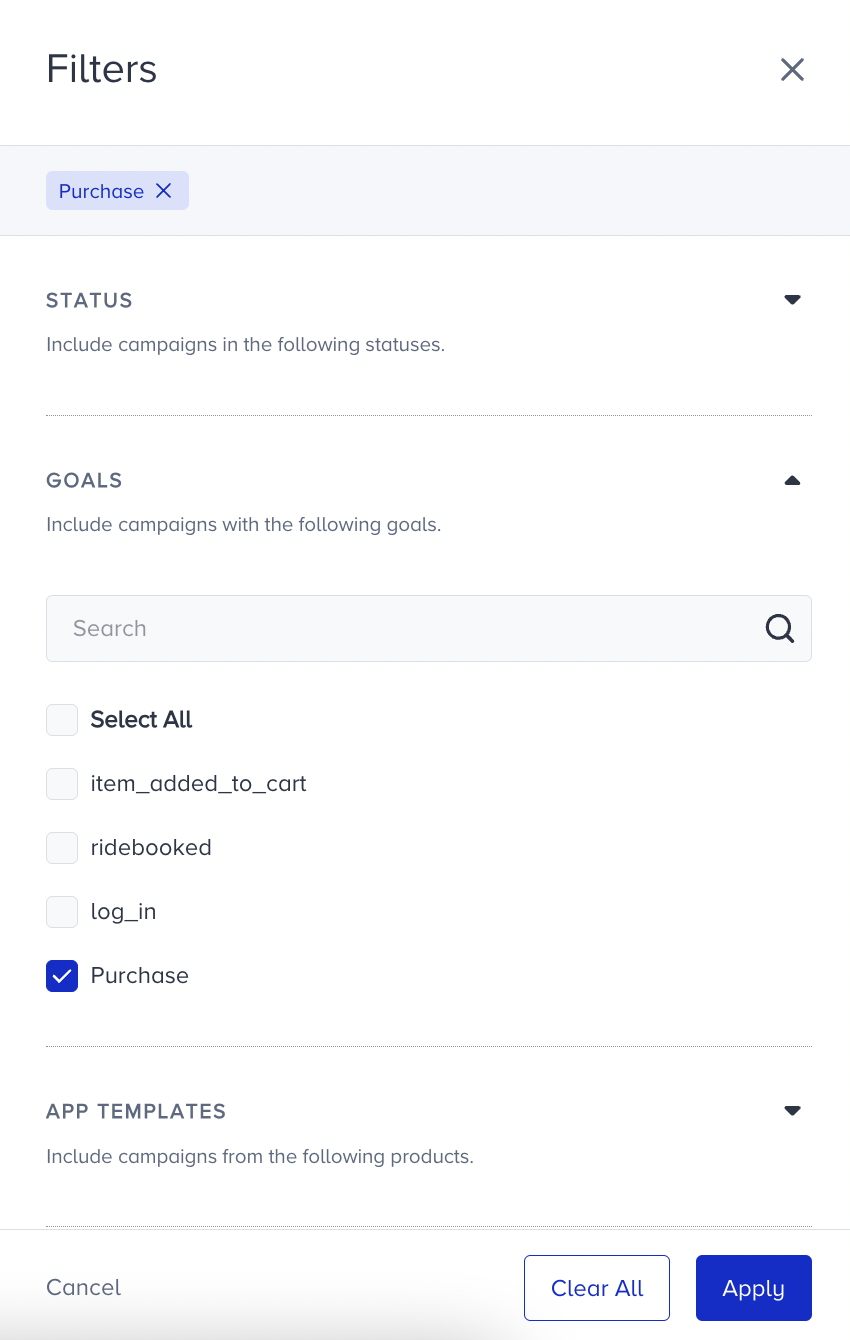
Filters are not mandatory but optional. You can use them to narrow down the campaigns that are included in the stats.
The filter options are Status, Goals, App Templates, Impressions, Control Groups, Conversions, and Tags.
Status
Status helps you see the campaigns on a specific activation status. For example, you can see the campaigns that are Scheduled for a future date or those that are waiting for their next run on the Awaiting Next Run status.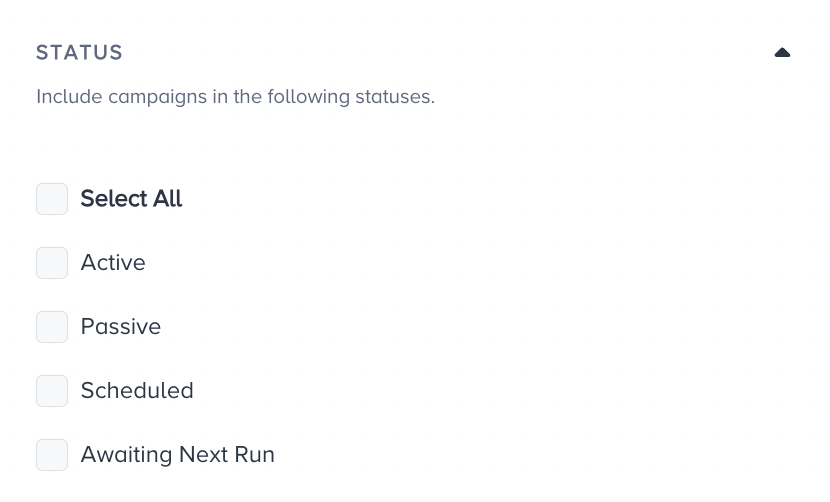
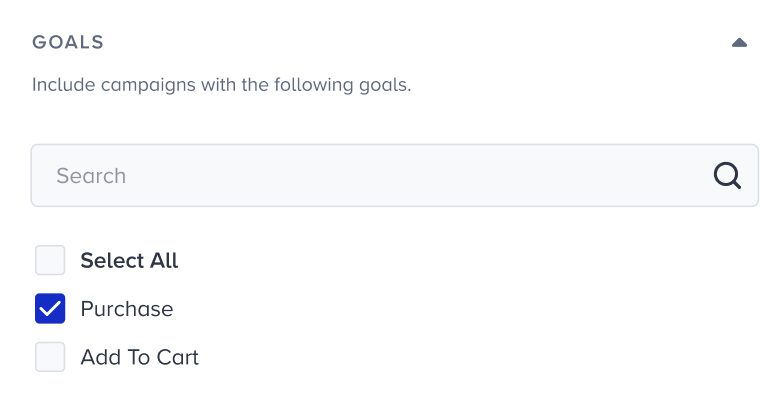
Goals
This filter allows you to get the campaigns that have the selected goals. You can add up to 5 goals as purchase and 5 goals as campaign goals. When you select any event, the campaigns that have this event as one of the goals will be listed on the dashboard. For example, if you want to see the campaigns with the Purchase goal only, you can select the Purchase option and get the campaigns with this goal.
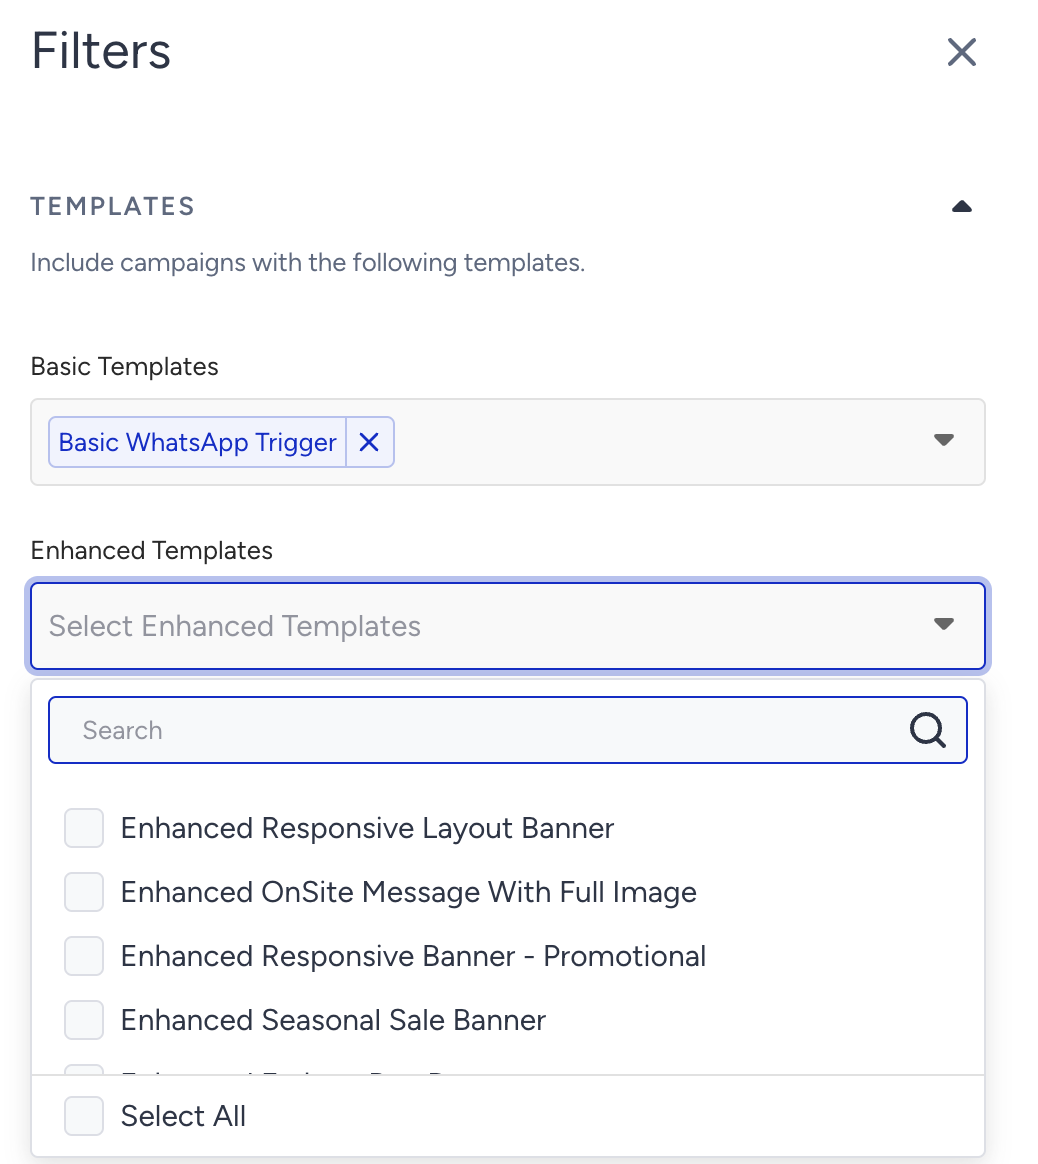
Templates
You can filter your campaigns based on the template type. For example, if you want to see only your WhatsApp Trigger campaigns, you can select the Basic Template > WhatsApp Trigger template type to view the data for these campaigns with other filters applied.
Impressions
This filter helps you set a minimum value for the impressions metrics. Accordingly, the campaigns that have the defined number of impressions or more are calculated in the overall metrics. For example, you can view the campaigns that have at least 100 impressions.
Control Groups
This is a visual filter for the With Control Groups tab. You can use this option to see the values of the control groups within the campaigns data table.
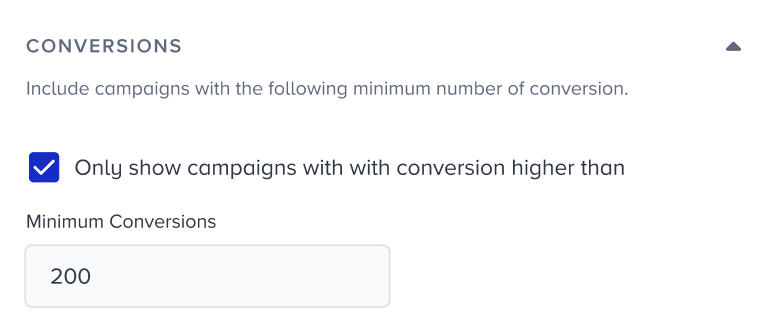
Conversions
This filter allows you to set up a minimum limit for the conversion count of the campaigns. For example, if you want to see the campaigns with more than 100 conversions, you can set this filter to 100.
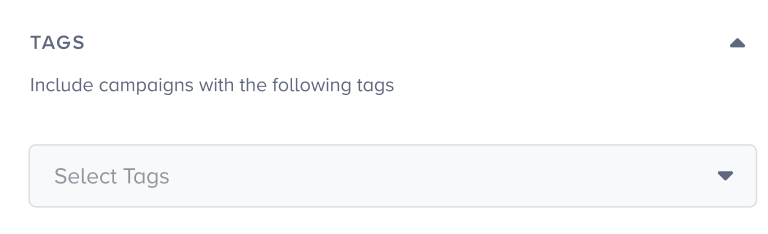
Tags
Tags option helps you see campaigns only with a specific tag. You can select your tags and filter the campaign list on the dashboard. For example, you can filter them by a Black Friday tag you created before to see the respective metrics.
Above the filters modal, you can see all applied filters. You can add/remove any filter at any time, and clear all of them at once. Make sure to click the Apply button to see the filters applied on the data.
Export/View Reports
You can view and export your App Templates analytics easily.
1. After you filter the data you want to export, click the Reports > Export button.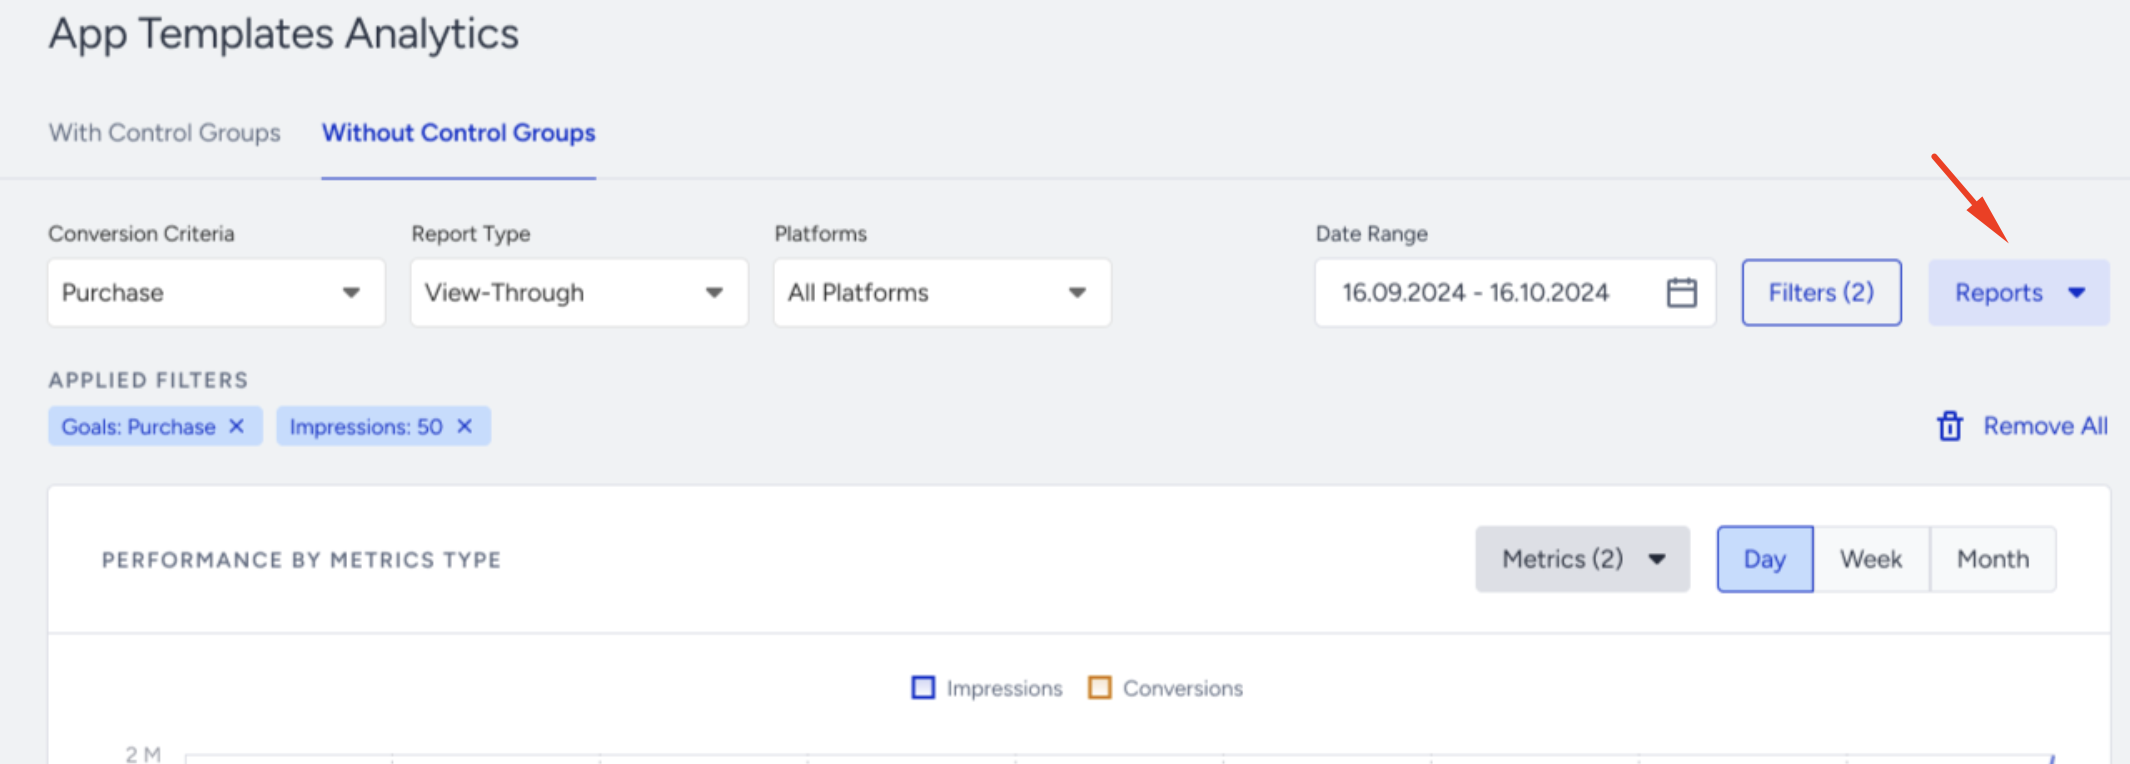
2. You will see Single Report and Recurring Report options to create your report. Choose the one you need and proceed.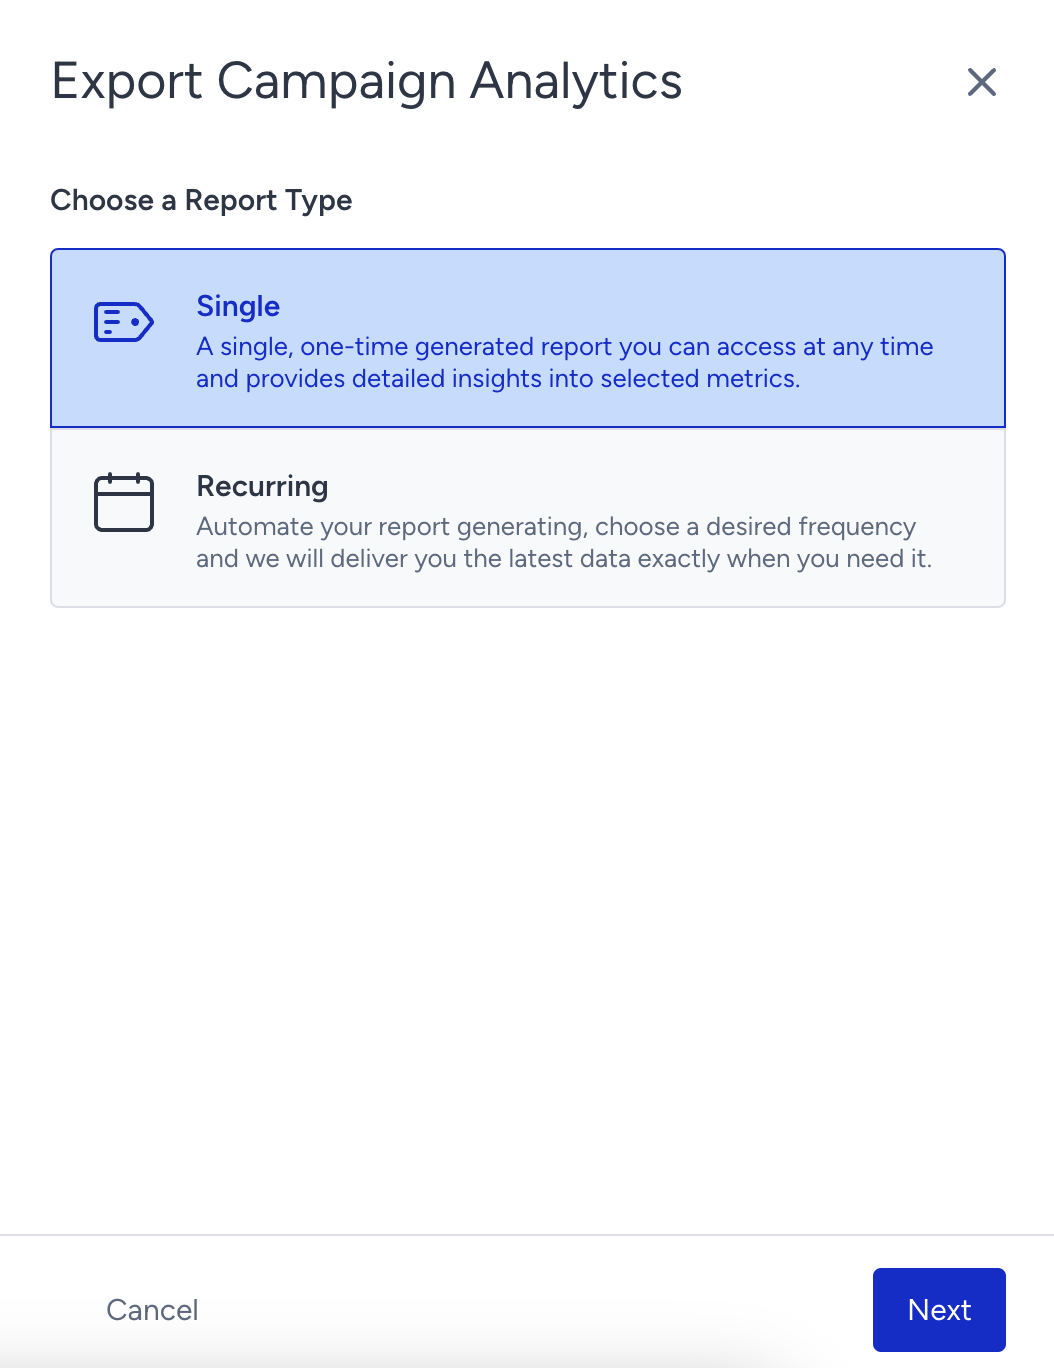
2.1. Single Report is a one-time generated report that you can access any time and it gives you detailed insights about your results based on metrics you selected. You can get your report with or without filters you applied. Click the Create Report button to receive it.  2.2. Recurring Report enables you automate your report creation depending on your desired frequency choice. Therefore, you receive the latest data at the time you need. It is a user-based report. After you configure the recurrence and range settings, click the Create Report button.
The exported file includes overall analytics, campaign metrics, interaction metrics, revenue metrics, and formulas.
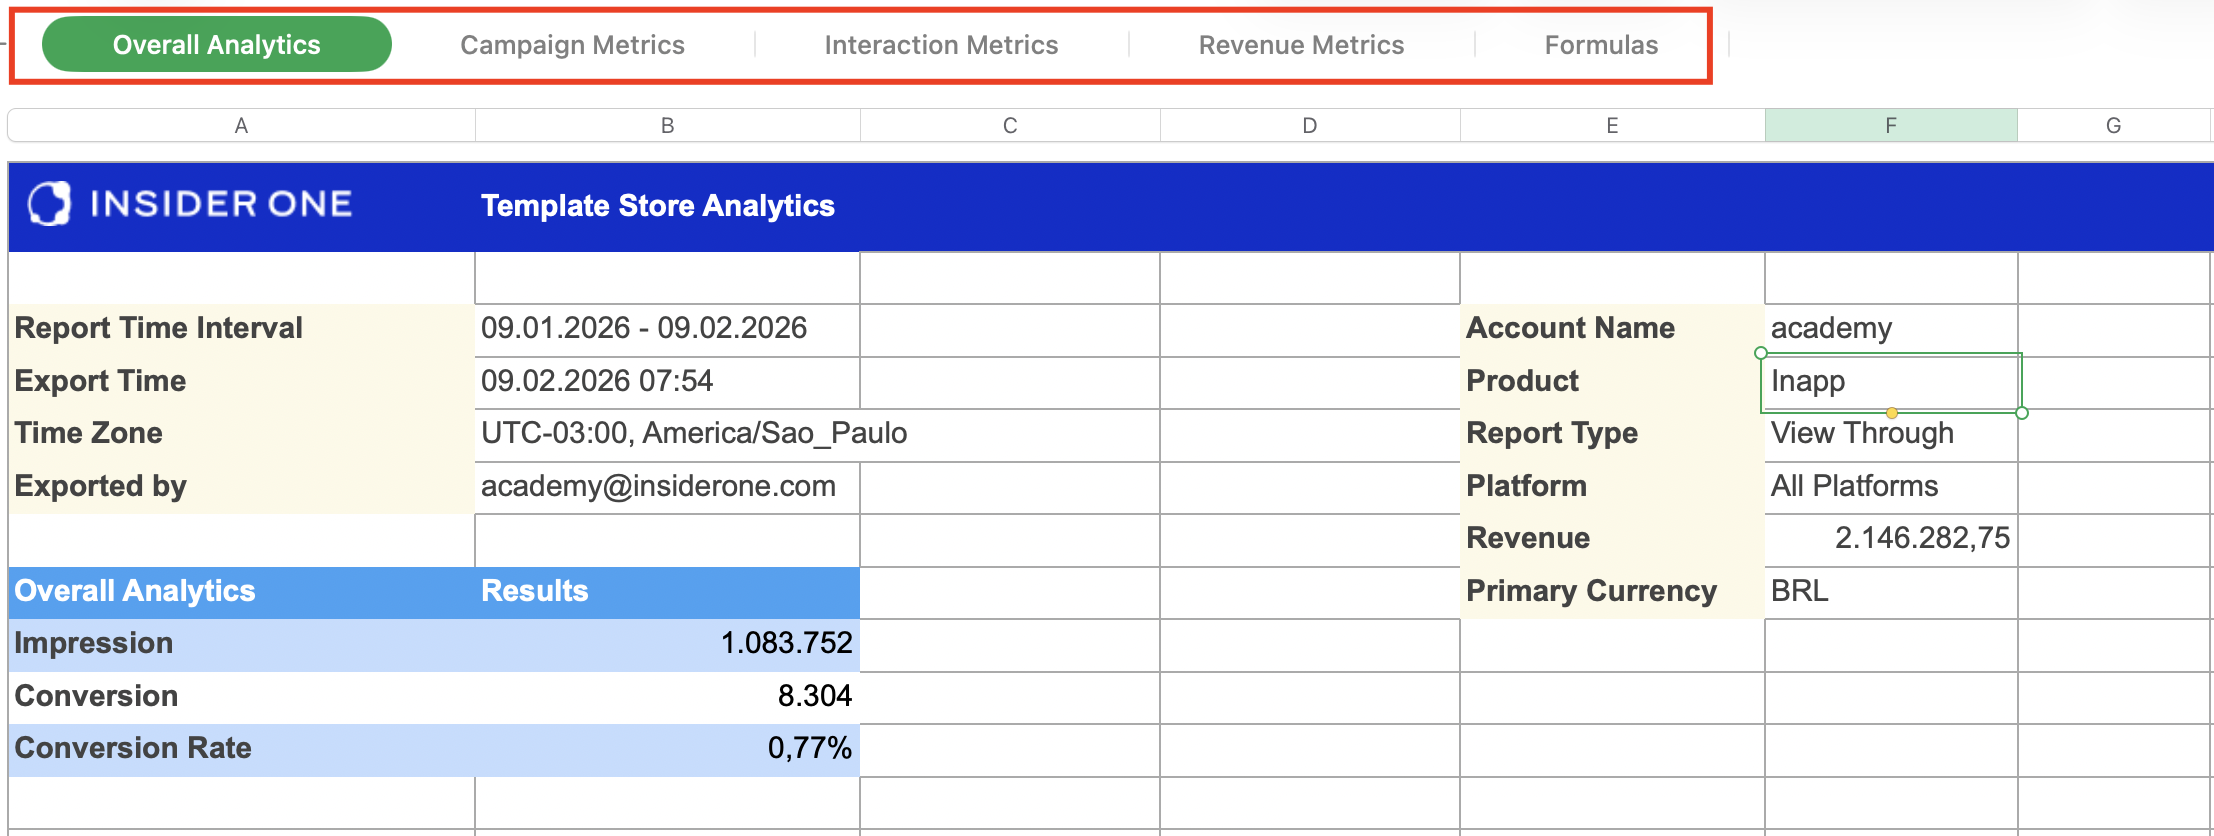
The campaign metrics tab displays campaign ID, campaign name, variant ID, variant name, purchase goal event, purchase goal parameter, purchase goal conversion, purchase goal conversion rate, purchase goal uplift, users, impressions, probability to win, overall revenue, status, type, segmentation name, active days, start date, start time, end date, end time, bypass frequency capping, re-eligibility duration, and tags.
The interaction metrics tab displays campaign ID, campaign name, variant ID, variant name, button click, image click, coupon button click, close button click, overlay, segmentation name, start date, start time, end date, end time, bypass frequency capping, re-eligibility duration, and status.
The revenue metrics tab displays campaign ID, campaign name, variant ID, variant name, overall revenue, view-through duration, click-through duration, and primary purchase parameter.
The formulas tab displays how to calculate impressions, revenue, incremental revenue, conversion rate, conversions, conversion rate uplift, incremental conversions, average order value, significance, and unique users.
Graph
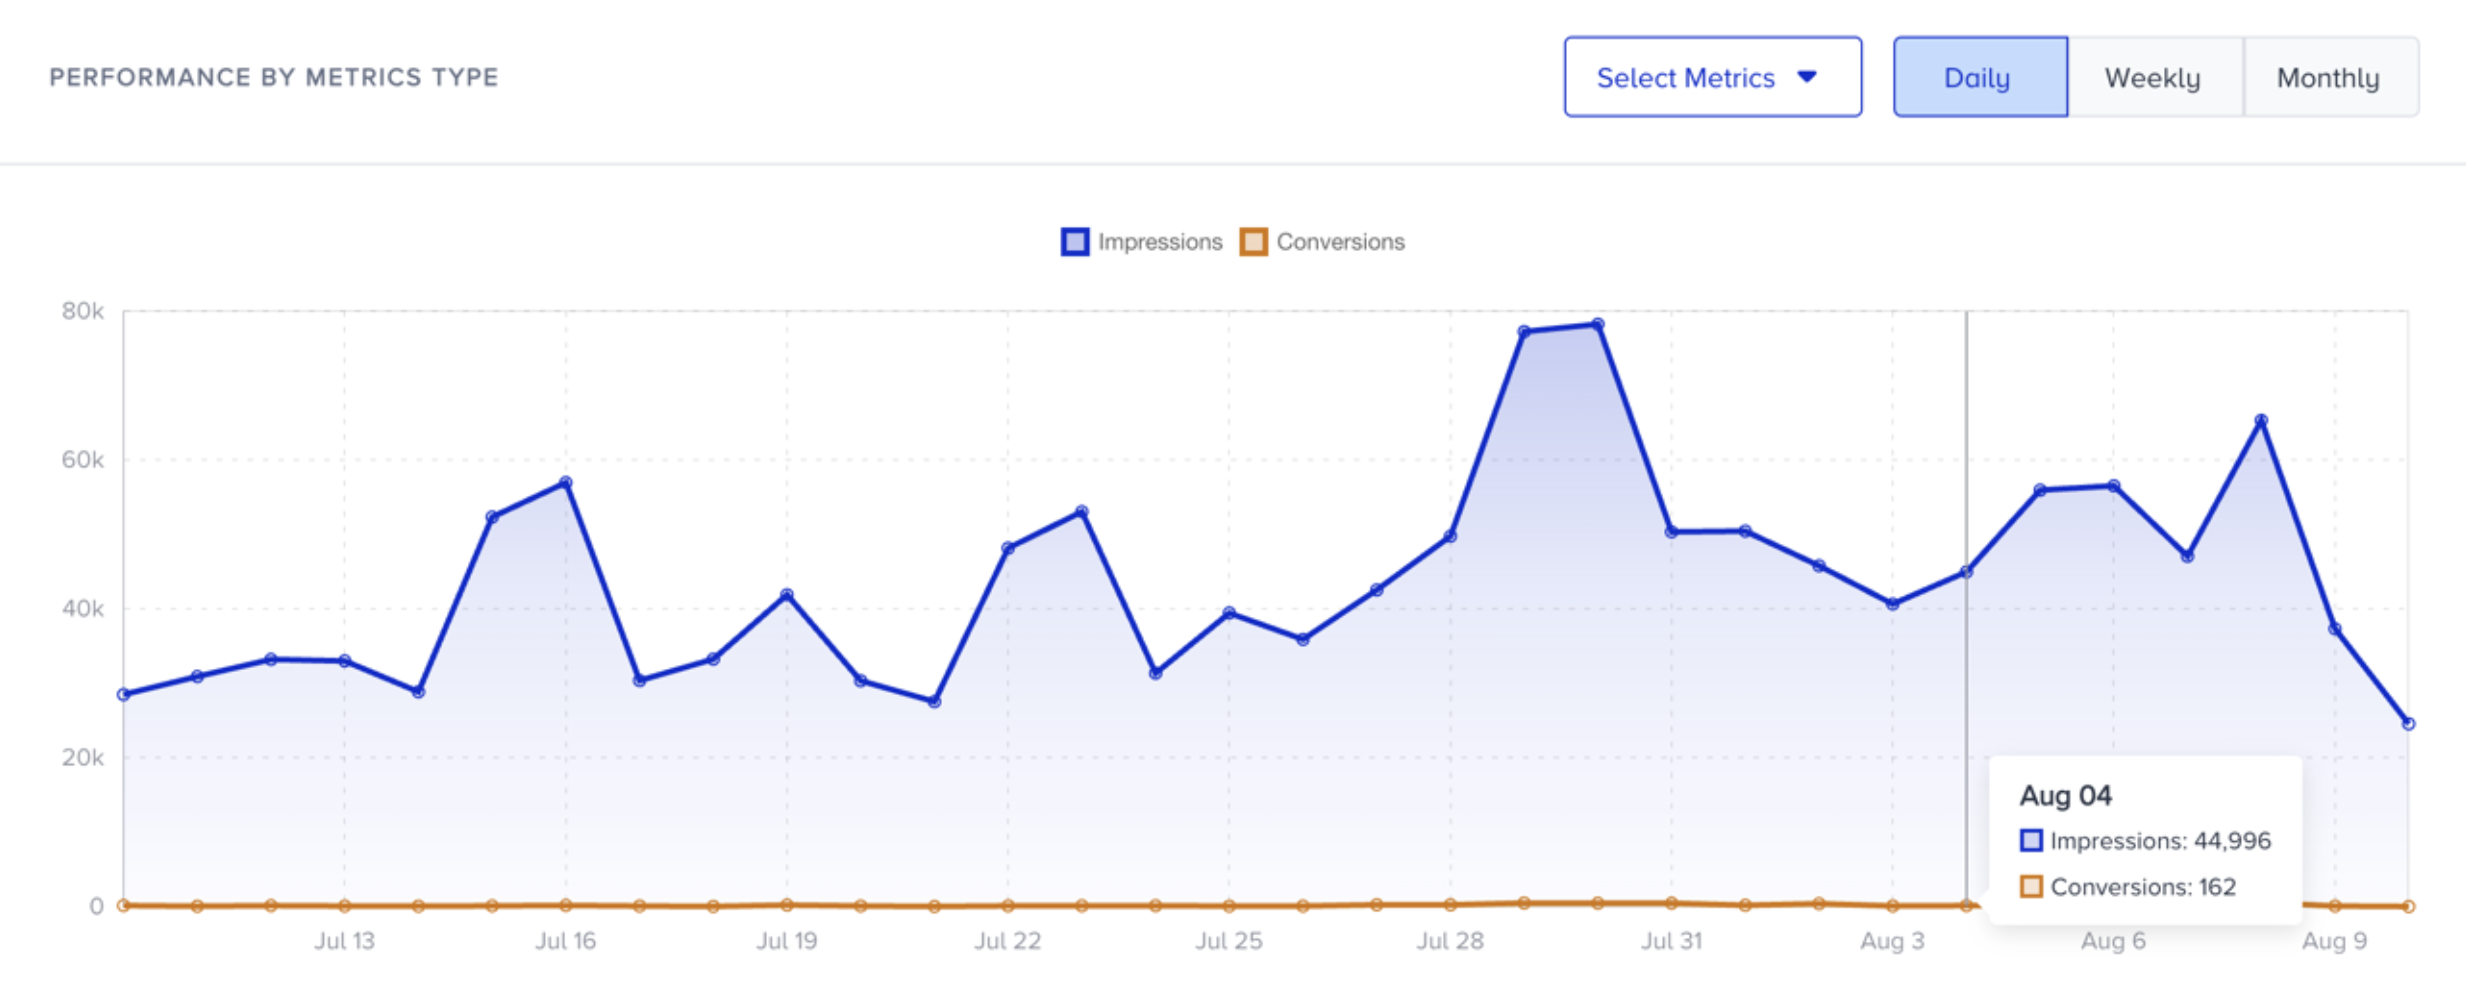
You can view the Impressions and Conversions metrics of your campaign on a daily, weekly, or monthly basis based on your date range. This graph helps you see the change of these metrics over time.
You can click the Select Metrics button to view and compare these metrics.
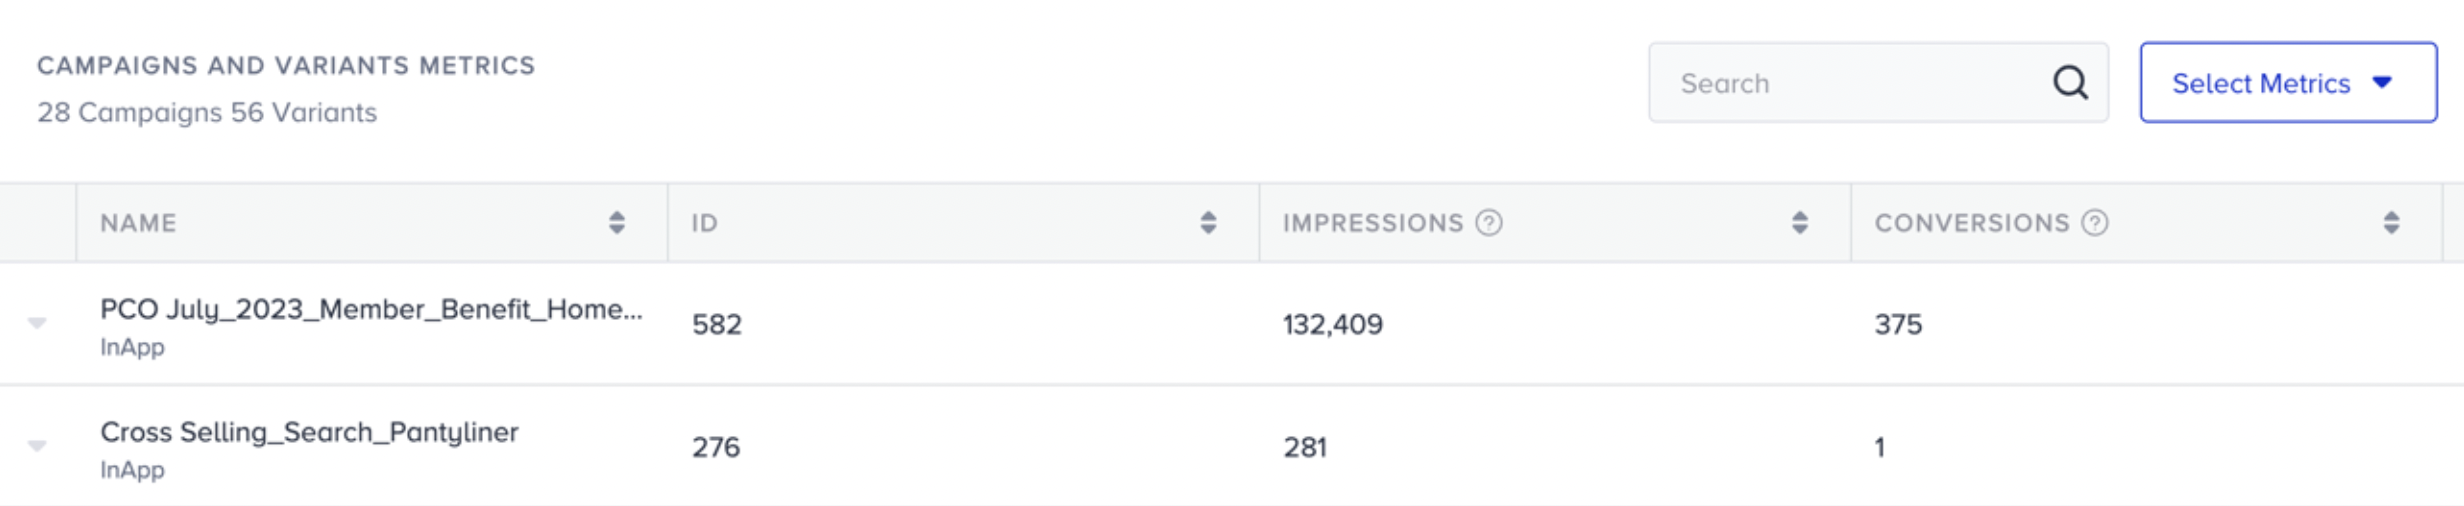
Campaign Metrics Data Table
The campaigns data table displays all available metrics. You can search your campaigns by their names or IDs. You can also specify the metrics you want to see on the table.
You can click and see the details of your campaigns, or go to their campaign-level reports.
Below you can see the variation metrics and their formulas.
| Variation Metrics | Formulas |
|---|---|
| Current Status | Passive/Test/Active |
| Starts On | dd/mm/yyyy |
| CR Uplift | Var (CR) / CG (CR) - 1 |
| Control Group Impressions | Number of CG impressions |
| Variation Group Impressions | Number of Var Impressions |
| Incremental Conversions | Var (Conv) - (Var (Imp) x CG (CR)) |
| Control Group Conversion Rate | CG (Conv) / CG (Imp) |
| Variation Group Conversion Rate | Var (Conv) / Var (Imp) |
| Control Group Revenue | Revenue gained by the control group |
| Variation Group Revenue | Revenue gained by variation group |
| Control Group Conversions | Number of successful accomplishment of the selected goal gained through the control group. |
| Variation Group Conversions | Number of successful accomplishment of the selected goal gained through the variation. |