Suggested reading:
What is the change in the calculation method for "Impressions"?
To enhance metric accuracy and improve the interpretation of Smart Recommender campaign performance, ultimately enabling more informed decisions about your campaigns, two subsequent changes have been applied to Smart Recommender Analytics.
What is the reason for these changes?
The most effective way to measure impressions for Smart Recommendation campaigns, which focus on recommended products, is by tracking the number of products viewed. This approach enables you to analyze the number of end users who view the products you recommend on your website, evaluate your click-through, add-to-cart, and conversion rates, and ultimately enhance the performance of your campaigns.
These enhancements will significantly improve your understanding of the performance of your Smart Recommender campaigns, enabling you to make more informed decisions.
You can refer to the sections below to find the details and timeline of the implemented changes:
September 4, 2024 Update
Effective September 4, 2024, an impression will be recorded only when at least 50% or more of the 'product card' (which includes elements like the product image, product information, and buttons such as 'add to cart' and 'add to wishlist') is visible on the user’s screen. This change provides more reliable information about the number of impressions your products and campaigns generate.
While this may result in a slight decrease in the number of recorded impressions for your products and campaigns, it does not impact your revenue or the overall performance of your campaigns.
May 29, 2024 Update
Before May 29, 2024
Impressions would be calculated based on how many “pages” of the recommendation carousel the end user viewed (Refer to the “After March 20, 2024" section).
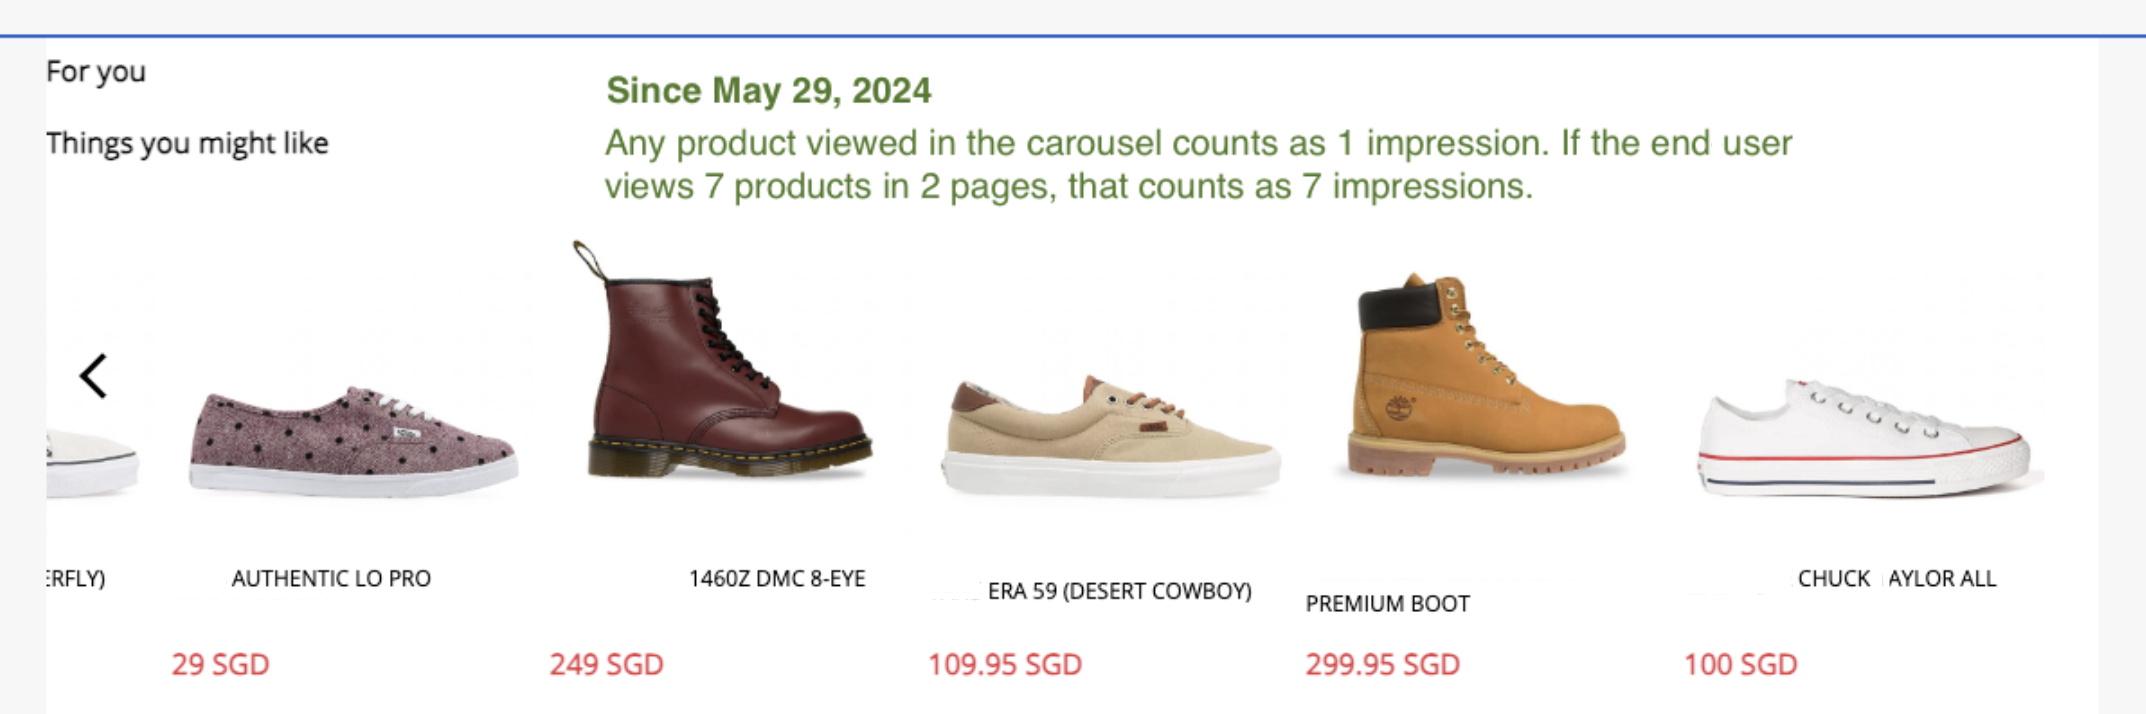
Since May 29, 2024
Impressions are now calculated based on the number of products the end user views.
Scenario 1: A carousel with 16 products shows four of them in the viewport at any time, and a new product (replacing one currently in the viewport) is brought into view when the end user clicks the "arrow."
Initially, the end user sees the first four products, which count as four impressions. If the end user clicks the arrow twice to bring 2 new products into the viewport, one by one, that adds 2 more impressions. If the end user clicks the arrow until all products are viewed in the viewport, it results in 16 impressions for 16 products.
Scenario 2: A carousel with 16 products displays four products in the viewport at any time and replaces them with a new set when the end user clicks the "arrow."
Initially, the end user sees the first four products, which count as four impressions. When the end user clicks the arrow once to bring a new set of four products into the viewport, that adds four more impressions. If the end user clicks the arrow twice more to view all four sets of products, it results in a total of 16 impressions for all 16 products.
The effects of the change - May 29, 2024
Similarly, this change may result in a slight decline in your click-through, add-to-cart, and conversion rates after May 29, 2024, as the number of impressions generated by your campaigns has increased further with this change in the calculation method. However, neither the performance of your campaigns nor your revenue has changed.
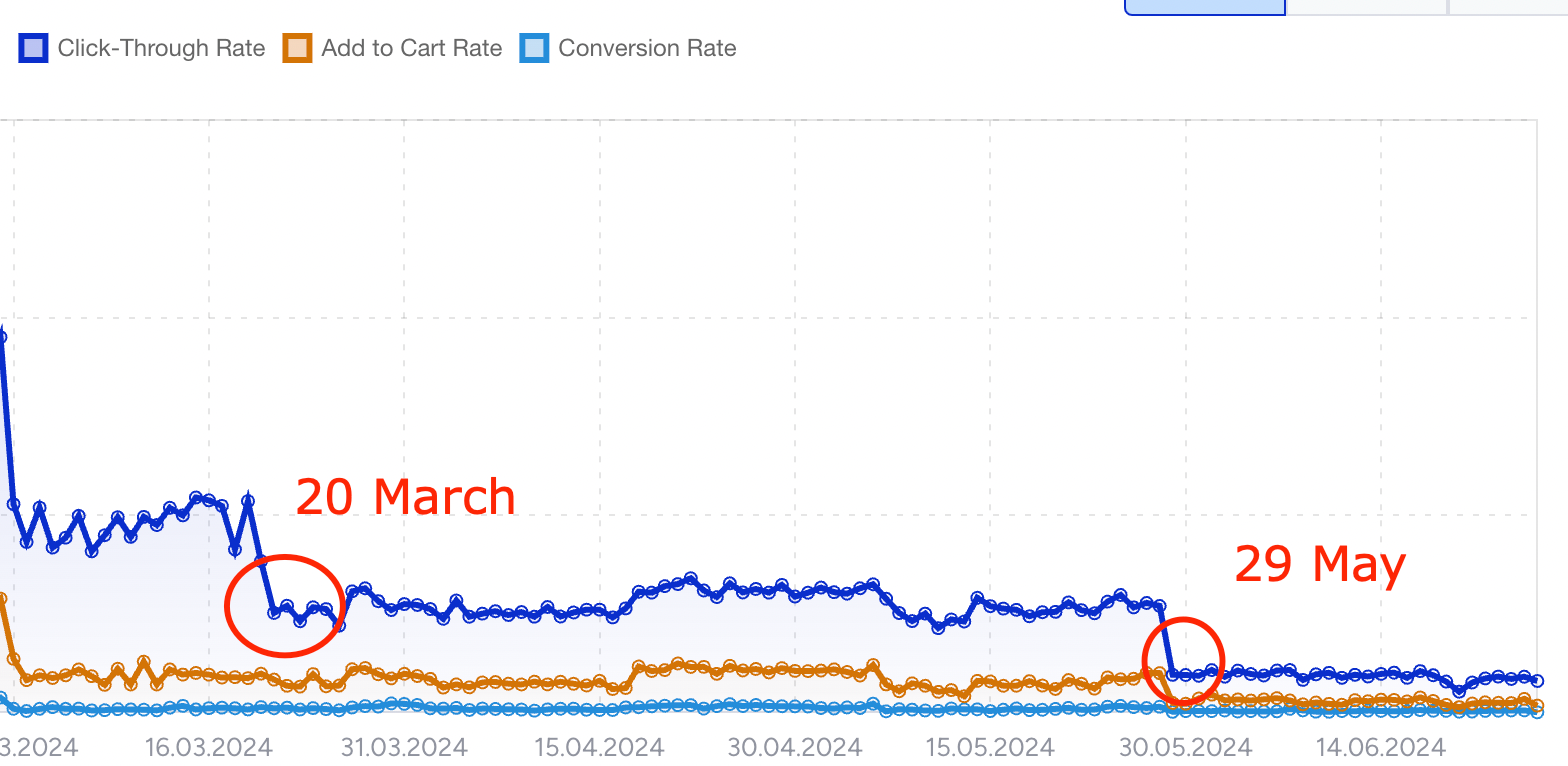
A typical graph might look like this after these changes, but only the method for calculating impressions has been updated; no other aspects have changed.
March 20, 2024 Update
Before March 20, 2024
The entire recommendation carousel (widget) would generate only one impression, regardless of the number of pages and products it includes or how many of those pages and products are viewed by the end user.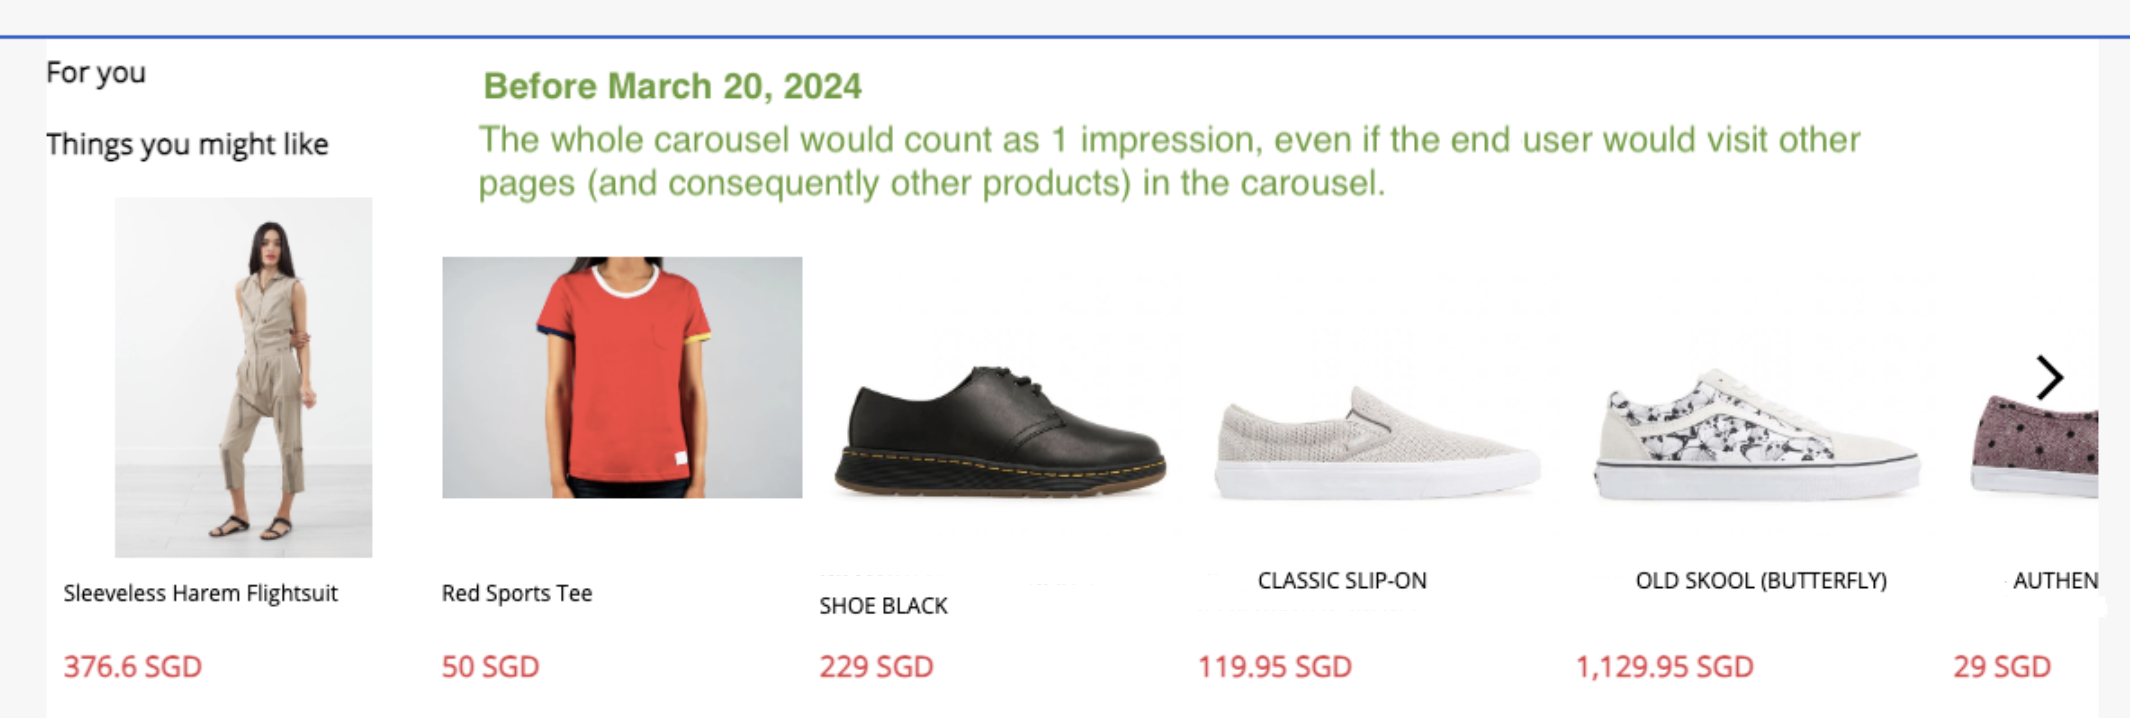
After March 20, 2024
On March 20, the calculation method was updated to count impressions based on the number of "pages" of the recommendation carousel that the end user viewed. In this method, a "page" refers to a new product or set of products appearing in the carousel viewport after the user clicks the "arrow." Essentially, any arrow click that brings a new product into the viewport counts as an impression.
Scenario 1: A carousel with 10 products displays five of them in the viewport at any time, bringing a new product into view when the end user clicks the "arrow," thereby replacing one currently in the viewport.
In this case, the initial view of the carousel is counted as one impression. Each subsequent arrow click that brings a new product into the viewport counts as an additional impression. For example, if the end user clicks the arrow once, it adds one more impression. If the user clicks the arrow two more times, it adds another two impressions. Therefore, a total of 4 impressions will be recorded.
Scenario 2: A carousel with 10 products displays five products in the viewport at any time and replaces all five with a new set when the end user clicks the "arrow."
In this case, the initial view of the carousel counts as one impression. When the end user clicks the arrow to bring a new page, replacing all five products in the viewport, it counts as one more impression. Therefore, a total of two impressions will be recorded.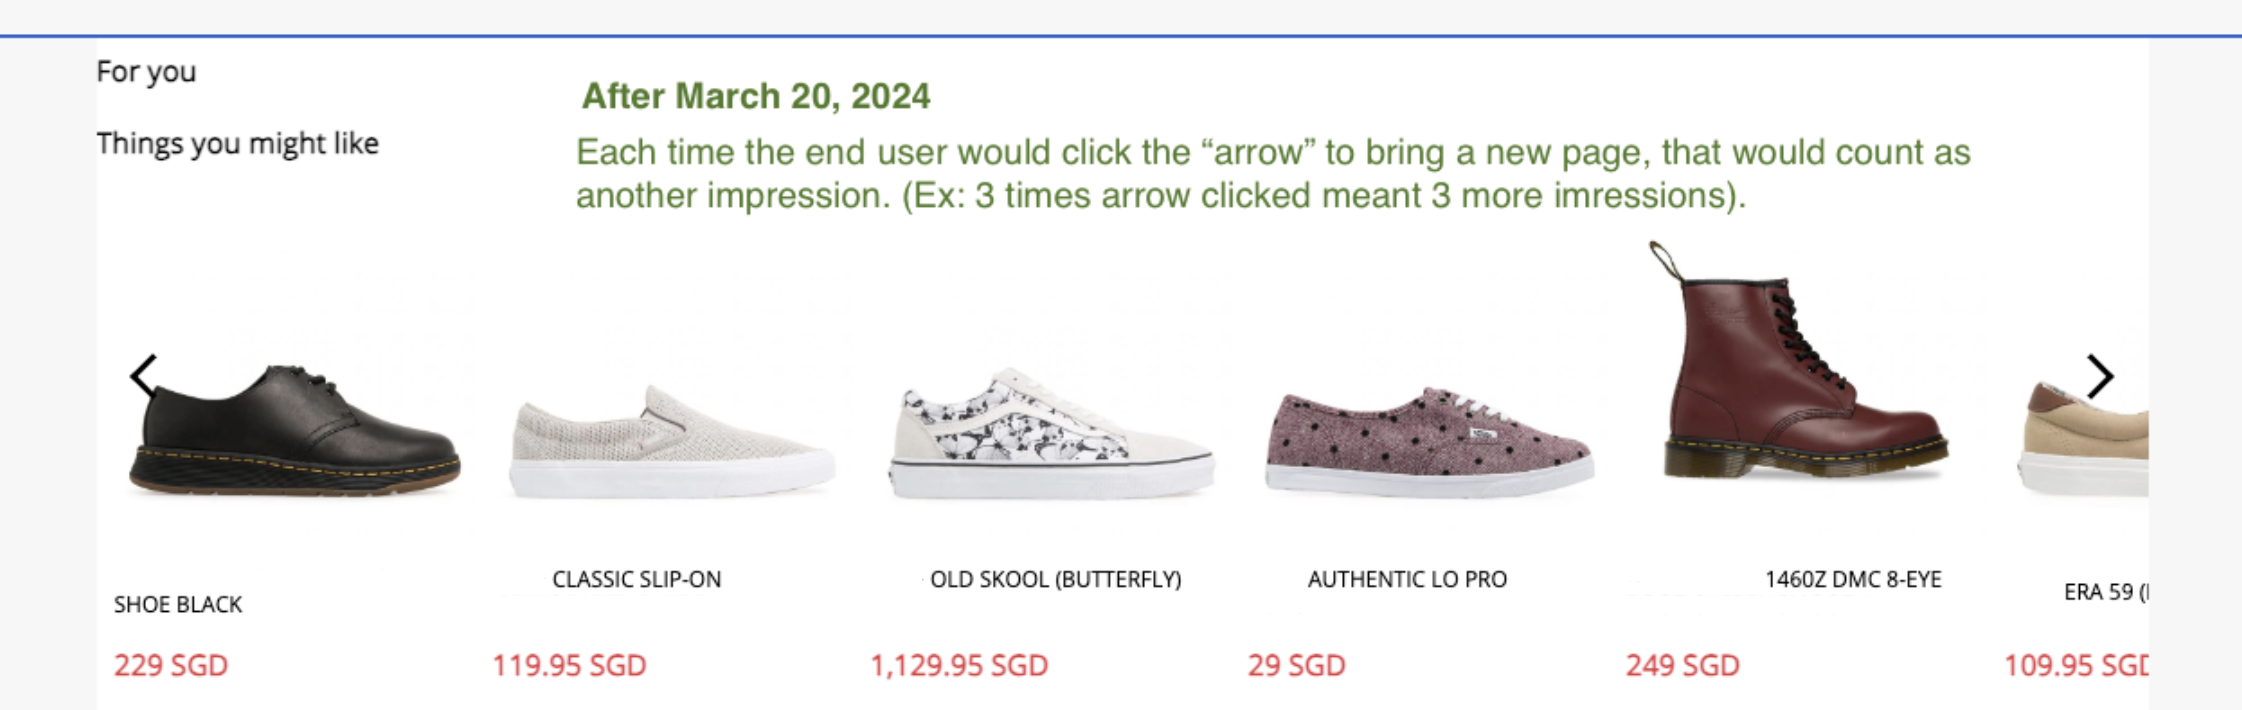
The effects of the change - March 20, 2024
This change may result in a slight decline in your click-through, add-to-cart, and conversion rates after March 20, 2024, as the number of impressions generated by your campaigns has increased due to the updated calculation method. However, your revenue and the overall performance of your campaigns have not changed.
What is the difference between Smart Recommender Analytics and Smart Recommender Campaign-Level Analytics?
Smart Recommender Analytics: No impression is initially recorded when a user lands on a page with a Smart Recommender campaign. An impression is recorded only when the user scrolls down and the campaign enters their viewport (impressions correspond to the number of visible products). To attribute a conversion, the user must click on a product. Only products purchased within the specified attribution window (x days) after the click are counted as direct revenue and conversions. Revenue is attributed based on the products that were clicked and subsequently purchased.
Campaign-Level Analytics: An impression is recorded when a user lands on a page featuring a Smart Recommender campaign. All purchases made in that session (or within the timeframe specified in the browser storage settings of that campaign) are counted as conversions and attributed revenue.
What is the difference between Smart Recommender Analytics and Purchases from Click on Campaigns Analytics?
Smart Recommender Analytics displays the revenue generated specifically from products users clicked on within the Smart Recommender and subsequently purchased. It does not include the revenue from other products that users might have purchased without clicking on the Smart Recommender.
On the other hand, purchases from a click in campaign analytics indicate all revenue generated by a user after clicking on the Smart Recommender within the timeframe specified in the Goal Duration settings.
The data remains unchanged even when I adjust the attribution window. Shouldn't it lead to higher numbers when I increase the window, considering that my users will have more time to complete a purchase?
You're right! A larger attribution window generally results in higher numbers, but not always. The reason depends on the behavior of your end users. If you increase the attribution window from 7 to 30 days and none of your users waited more than 7 days to complete a purchase, the results won't change because all users completed their purchases within 7 days.
On the contrary, if you make the attribution window smaller, you can expect the metrics to be lower, as it is unlikely that all your users will complete their purchases in the same session. Please contact the Insider One team to check on your integration in such cases.
Why does Assisted Revenue never change, even between the same session and 30-day windows?
The answer lies in the definition of Assisted Revenue: products that are 'not clicked before (on another campaign or the current campaign)' and 'purchased in the same session with the user clicking on the recommender carousel at least once.'
Since Assisted Revenue only counts indirect sales made in a single session, it won't change based on the attribution window.
Why are there only 100 products listed in the product analytics? How can I reach the rest of the products that have generated revenue?
Managing the entire product catalog data on the page consumes a significant amount of resources and slows down page performance. To address these limitations and provide a summarized and easy-to-follow view of product performance on the analytics page, Insider returns the top 100 products that have generated revenue, listed in descending order by revenue. To obtain a list of all products in the catalog that have been purchased at least once, you can open a support ticket.
Why do some campaigns show higher revenue in OnSite Campaign Analytics than in Smart Recommender Analytics?
This difference arises from the distinct goal conversion criteria used on the two pages. On-Site Campaign Analytics calculates conversions from impressions, while Smart Recommender Analytics calculates conversions from clicks. It's normal to observe lower conversions in Smart Recommender Analytics when some purchases involve products seen on the recommender but not clicked.
How is the winner algorithm selected in a campaign?
The Winner Algorithm determines the winning variant based on the highest direct revenue generated. If two variants have not generated any revenue, their Click-Through Rates (CTRs) are compared. If there are no clicks, impressions are compared to determine which variant has created the highest visibility for your products.