Eureka Analytics gives you a complete view of how your category listing experience drives customer engagement and sales. From the first category page view to the final purchase, you can track performance across categories, products, and product groups.
This helps you answer questions like:
Which categories drive the most value?
Which categories get views but don’t convert?
Which products perform best (or worst) when discovered via category browsing?
Category pages are a primary discovery surface, and customers browse, filter, sort, and compare before deciding. Category Listing Analytics helps you understand what’s working and what to improve so you can increase conversion and revenue from category browsing:
Measure category performance by tracking views, clicks, add-to-carts, conversions, and revenue.
Prioritize merchandising improvements by finding high-traffic categories with low CTR or low conversion, then adjusting sorting, facets, featured items, or content.
Validate improvements over time (for example, ranking/relevance changes) by monitoring CTR, conversion, and revenue trends.
Understand catalog impact by seeing how assortment, pricing, and availability changes show up in category performance.
Compare performance by segment (platform, locale, integration type) to identify where customer behavior differs.
To reach your Eureka Analytics dashboard, navigate to Reports > Eureka Analytics > Category Analytics, or go to the Category Analytics tab on Eureka’s homepage.
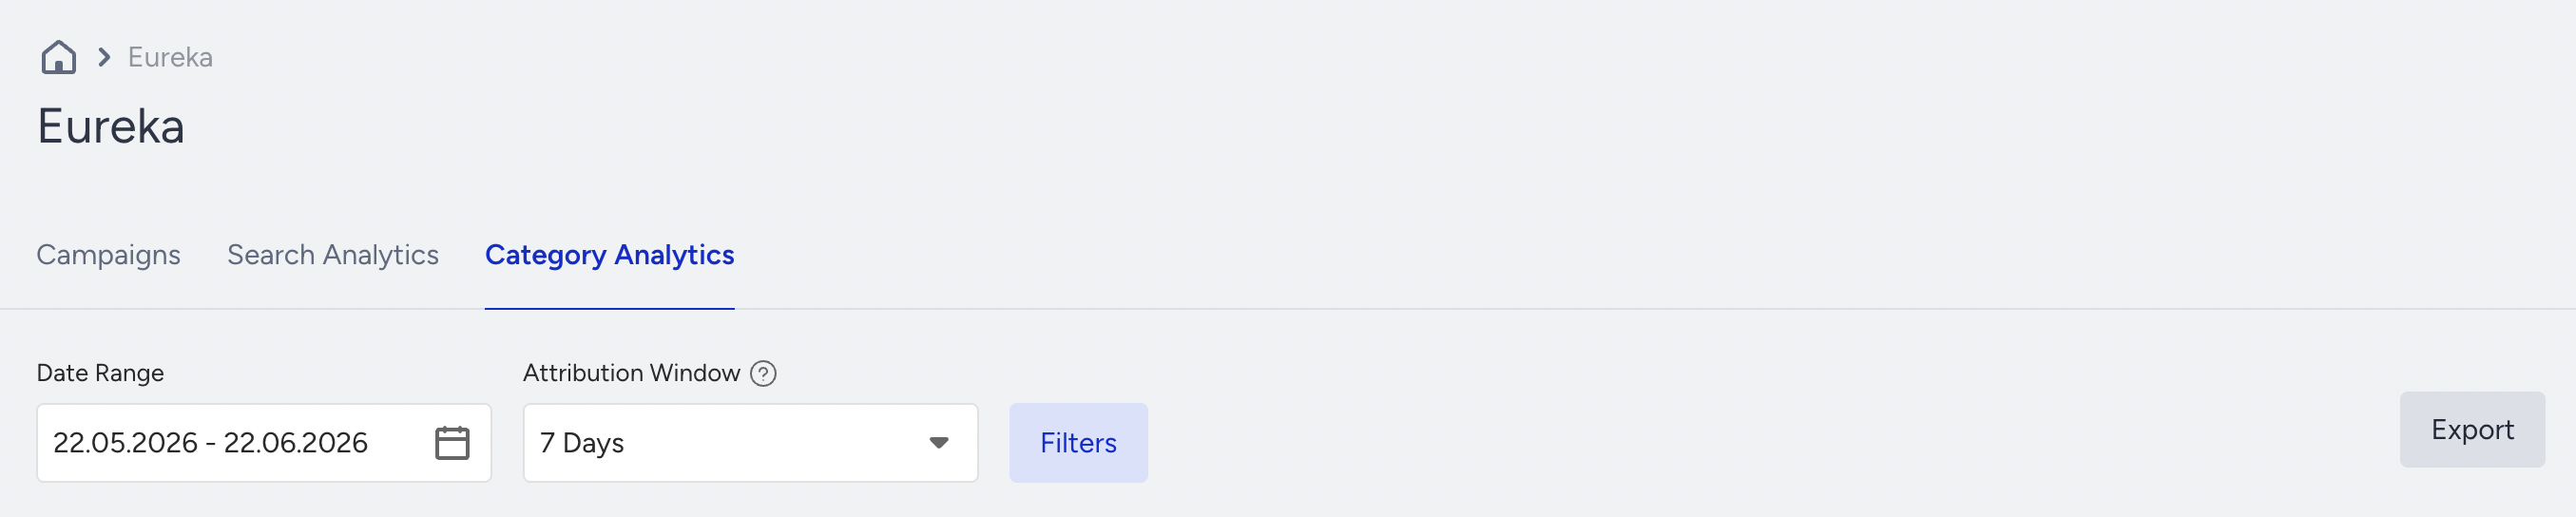
Filter and interpret metrics
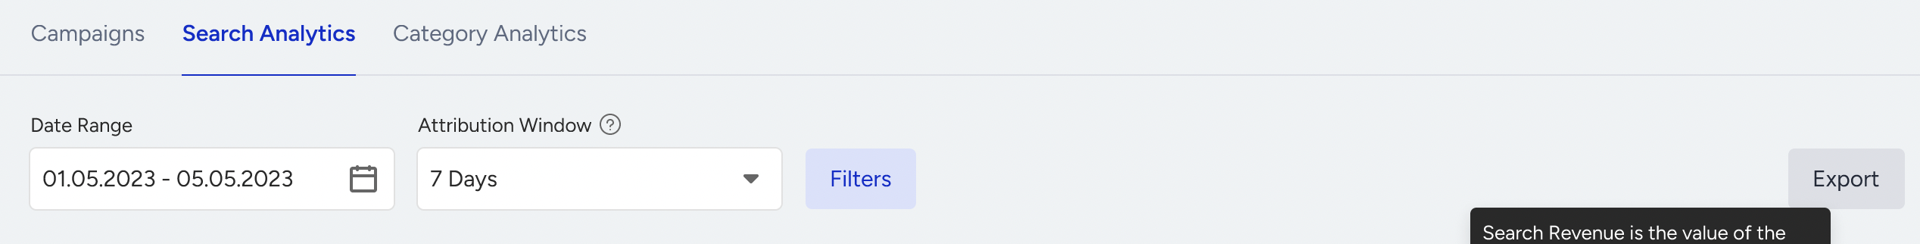
You can filter your analytics based on different options:
Attribution Window: Choose the time window used to attribute add to cart or purchase actions back to a product click.
Date Range: Limit which days are shown for all metrics.
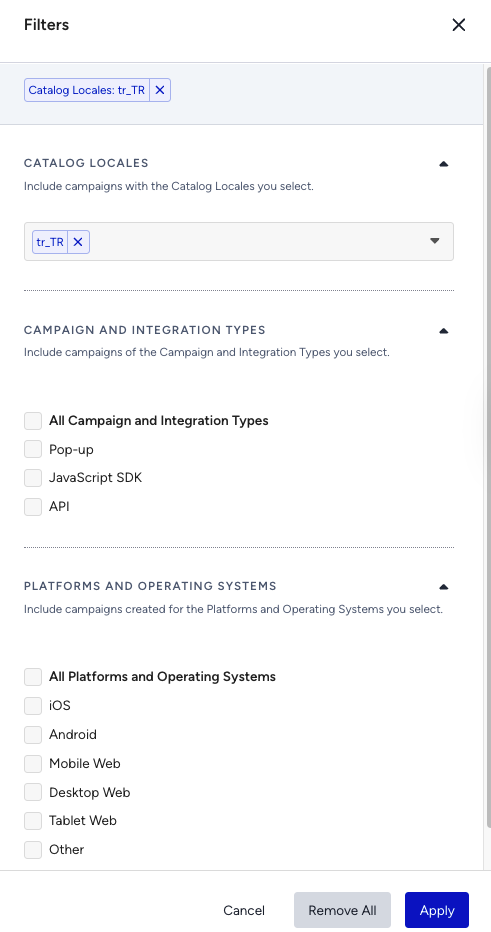
Catalog Locales: Multi-select locales to see metrics only for those activated locales.
Integration Types: Multi-select Pop-up, Javascript SDK, API for integration types
Platforms & Operating Systems: Multi-select IOS, Android, Mobile Web, Desktop Web, Other
Revenue Cards
To show both individual category listing revenue contribution and total Eureka revenue contribution, revenue is displayed as separate cards:
Category Listing Revenue: revenue attributed through the funnel Category view → Click → Purchase.
Search Revenue: the revenue attributed through the funnel Search → Click → Purchase.
Eureka Revenue: the combined revenue of Search + Category Listing.
How Eureka defines a category page view
Category Page View counting rule: Each category/collection page view counts as one category page view.
Each facet selection, sorting action, or pagination click after the initial category view generates a new category view. This means Category Page Views reflect real browsing behavior, not only the initial page load.
Attribution Window
How Eureka attributes add-to-carts and purchases back to clicks:
Eureka is designed to capture the real impact of product discovery on your revenue, even when customers complete their purchase days or weeks after they first interact with a product.
When a user clicks a product from a category listing, Eureka:
Saves that product as a “recently clicked” item in the browser’s local storage (via the referred-products object described in Insider One Cookies, Local Storage and Session Storage.
When an add-to-cart or purchase occurs, it matches the action to the most recently clicked product stored in local storage within your selected attribution window (for example, 7 days).
This period between engagement (product click) and goal action (add-to-cart or purchase) is called the Attribution Window. You can change it at any time to reflect your customers’ real buying behavior.
Why the attribution window matters
Different businesses have very different decision cycles:
If you are a fast‑moving consumer goods retailer, many customers will complete their purchase on the same day or even in the same session.
If you are a furniture retailer, customers might research and then complete their purchase 10–14 days or even a month after the first click.
If both use the same 7‑day attribution window:
The FMCG retailer will see most add-to-carts and purchases correctly attributed to Eureka.
The furniture retailer will miss add-to-carts and purchases that occur on day 10 or later, even if they start from an Eureka-powered category click, so analytics won’t reflect the true performance.
Choosing the right attribution window ensures you see the full contribution of Eureka to your add-to-cart and purchase goals, aligned with your customers’ real decision journey.
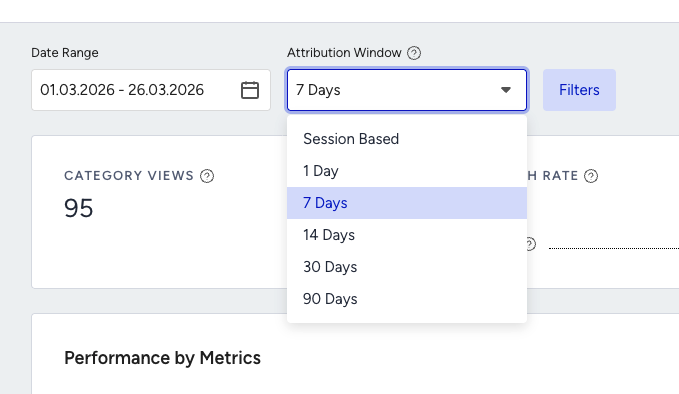
Available attribution window options
The attribution window is the time allowed for an end user to complete the add-to-cart or purchase of a clicked product. Events (add-to-cart and purchase) that occur within this window are attributed to the most recently clicked product (or its product group for variants) in local storage.
You can choose among:
Same Session
Same Session: Session starts when a user lands and ends after 30 minutes of inactivity (Eureka uses this session logic). One viewable impression is sent per session; a user can make multiple clicks/add-to-carts/purchases from the same campaign in a single session.
Note on Google Analytics 4: GA4 defines a session similarly (30 minutes of inactivity). Midnight and campaign-change rules in GA4 do not apply to Eureka’s session logic.
1 Day
7 Days
14 Days
30 Days
90 Days
Use shorter windows (Same Session / 1 Day) for fast purchase journeys, and longer windows (7–30–90 Days) for higher‑consideration products where customers take more time to decide.
Overall Category Listing Engagement Funnel Metrics
Eureka shows these funnel metrics in summary cards. Your core funnel KPIs are:
Category Views
Purchases
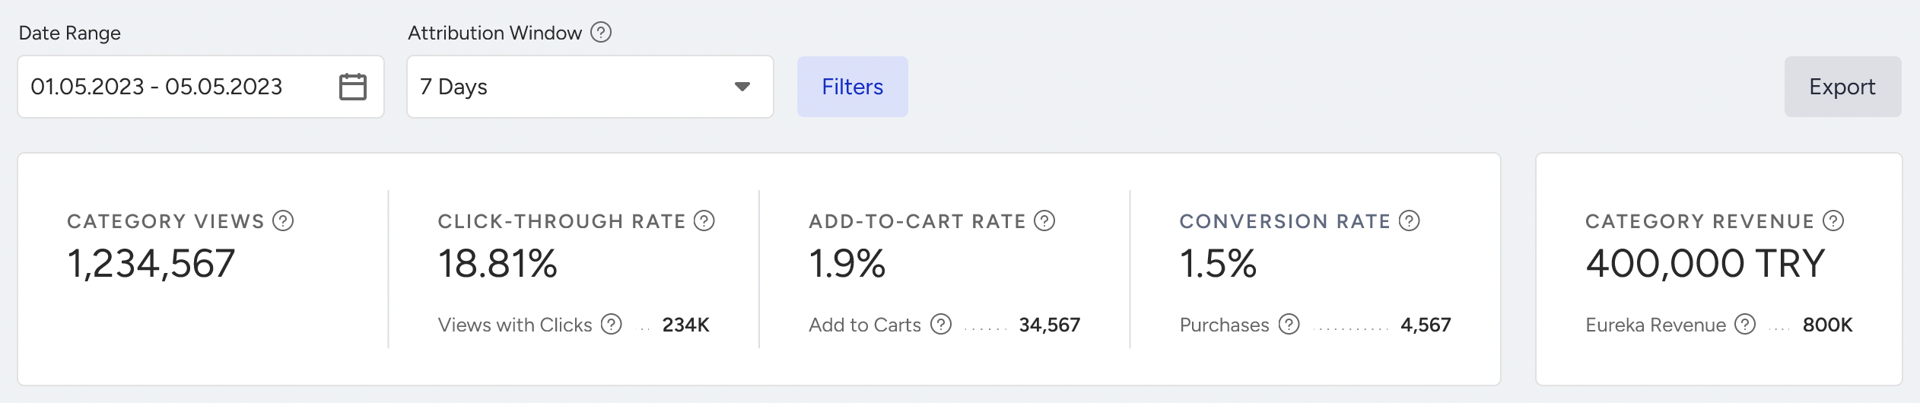
Category Views: Total number of category listing views.
Calculation: Each category/collection page view counts as 1 view. Each facet selection, sorting action, or pagination click after the initial view generates an additional category view. This way, Category Views reflect real browsing behavior, not just initial page loads.
Views with Clicks: Number of category views where at least one product click happened.
Click-through Rate (CTR): How often a category view leads to at least one product click.
Calculation: CTR = Views with Clicks ÷ Category Views
Add to Carts: Total add-to-cart actions attributed to category listing.
Calculation: Eureka counts add-to-carts only if the product was shown on a category listing, clicked, and then added to the cart within your selected attribution window.
Add to Cart Rate: Rate of add-to-cart actions attributable to category listing.
Calculation: Add to Cart Rate = Add to Carts ÷ Category Views
Purchases: Total purchases attributed to category listing.
Calculation: Purchases are counted only when the product was shown on a category listing, clicked, and purchased within the attribution window.
How purchases are counted: Purchases are counted by quantities sold, not “1 per product per order”.
Example: If one order contains a total of 5 items, Purchases = 5.
Conversion Rate: Purchase rate attributable to category listing.
Calculation: Conversion Rate = Purchases ÷ Category Views
Category Revenue: Revenue attributed to the Category view → Click → Purchase funnel, within the selected attribution window.
Eureka Revenue: Total revenue from Search + Category Listing combined, so you can see the full Eureka contribution.
Variant attribution with product group code
If the item added to cart or purchased is not the same SKU as the clicked product but a variant of it (for example, a different size or color), Eureka uses the product group code to keep attribution accurate:
The clicked product and the added-to-cart/purchased product are compared by group code.
If they share the same group code, the add-to-cart or purchase is attributed to the originally clicked product group, even if the SKU/variant is different.
Performance Metrics
The dashboard includes a timeline line chart so your team can spot trends over time.
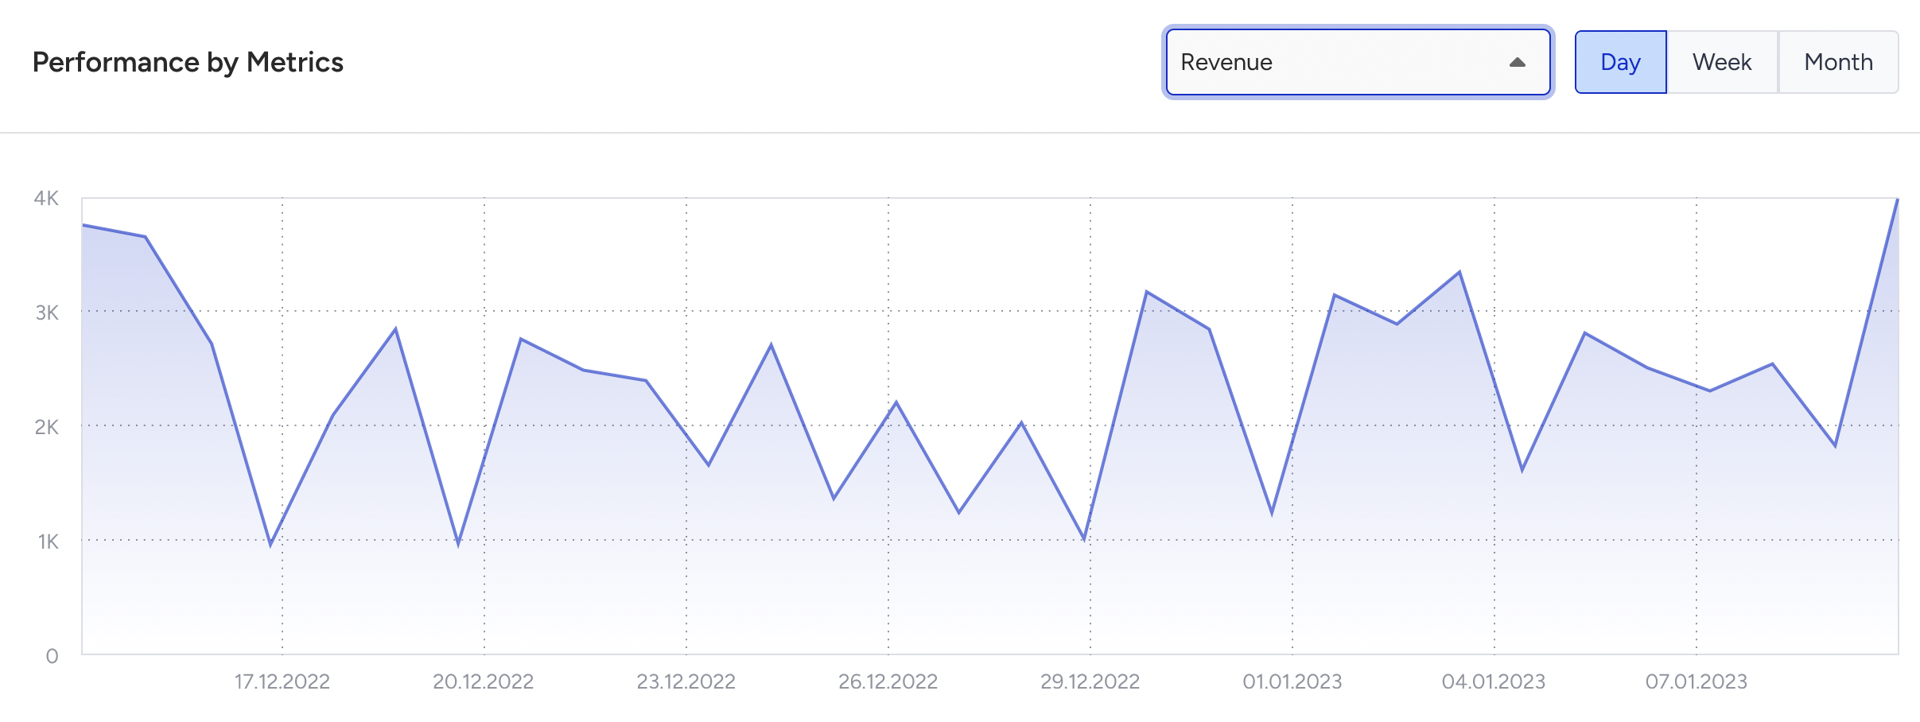
X-axis (time): Time is shown as daily, weekly, or monthly, depending on the date range you select.
Y-axis (selectable metrics): You can choose which metric to plot on the Y-axis:
Revenue
Category Views
Click Through Rate
Views with Clicks
Add to Cart Rate
Add to Carts
Conversion Rate
Purchases
You can use this chart to:
See how changes in sorting, facets, or merchandising affect views, CTR, add-to-carts, and purchases.
Compare short-term and long-term trends for your main funnel metrics.
Category, Product, and Product Group Insights
Beyond the overall funnel, Eureka lets you drill down into Top- and Low-performing categories, and then into products within each category. This helps you decide where to focus your optimization efforts.
Top Performing Categories & Low Performing Categories
The dashboard shows two tables:
Top Performing Categories
Low Performing Categories
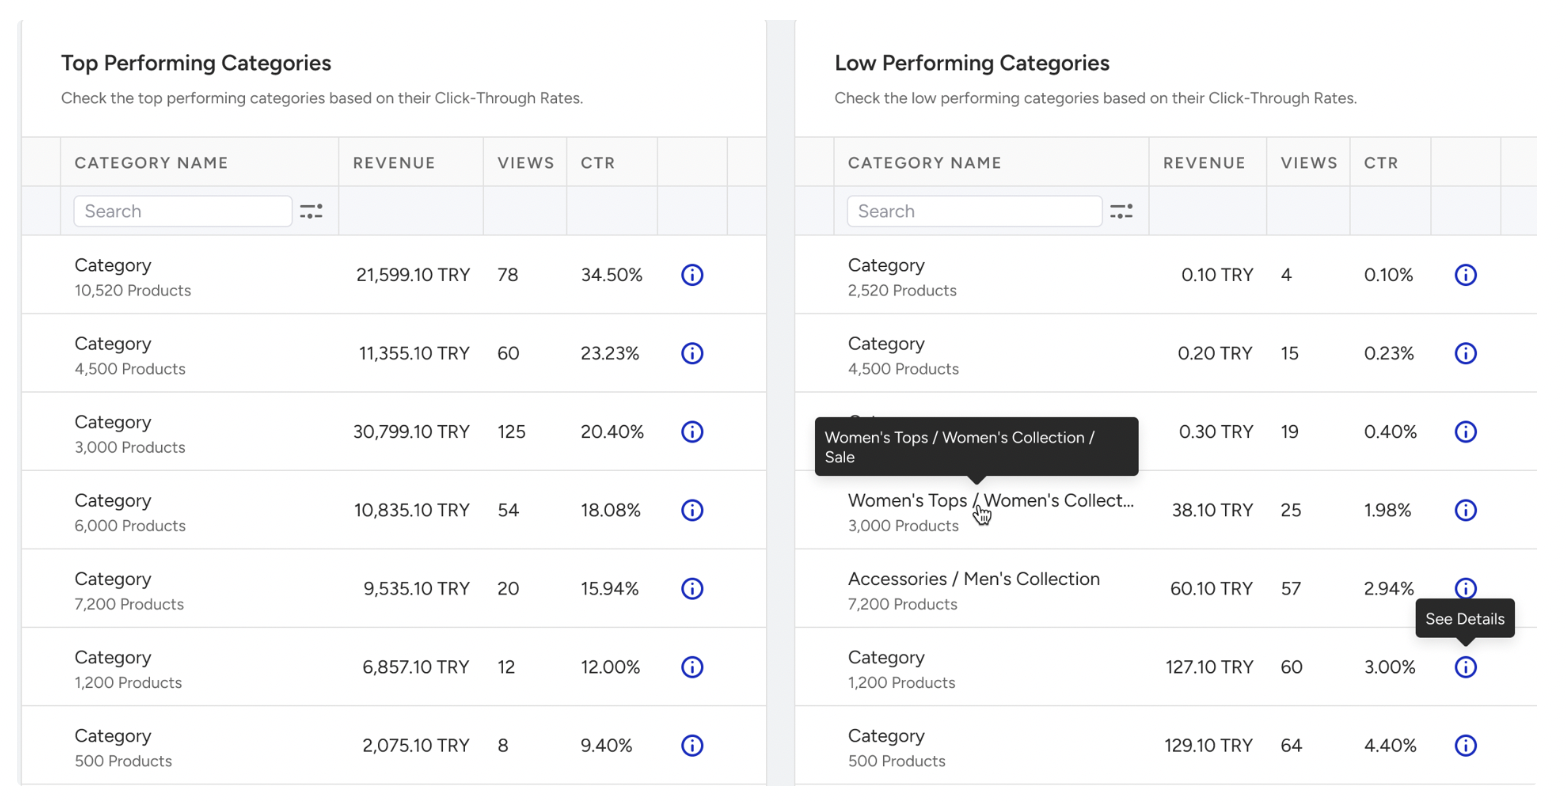
For the selected date range and attribution window, columns in both tables are:
Category Name
Revenue
Views
CTR
These views help you quickly find:
High-traffic categories that underperform in CTR or conversion.
High-value categories where your team might want to invest even more.
Category drill-down
Each row has an Info icon that opens a modal with details for that specific category when clicked:
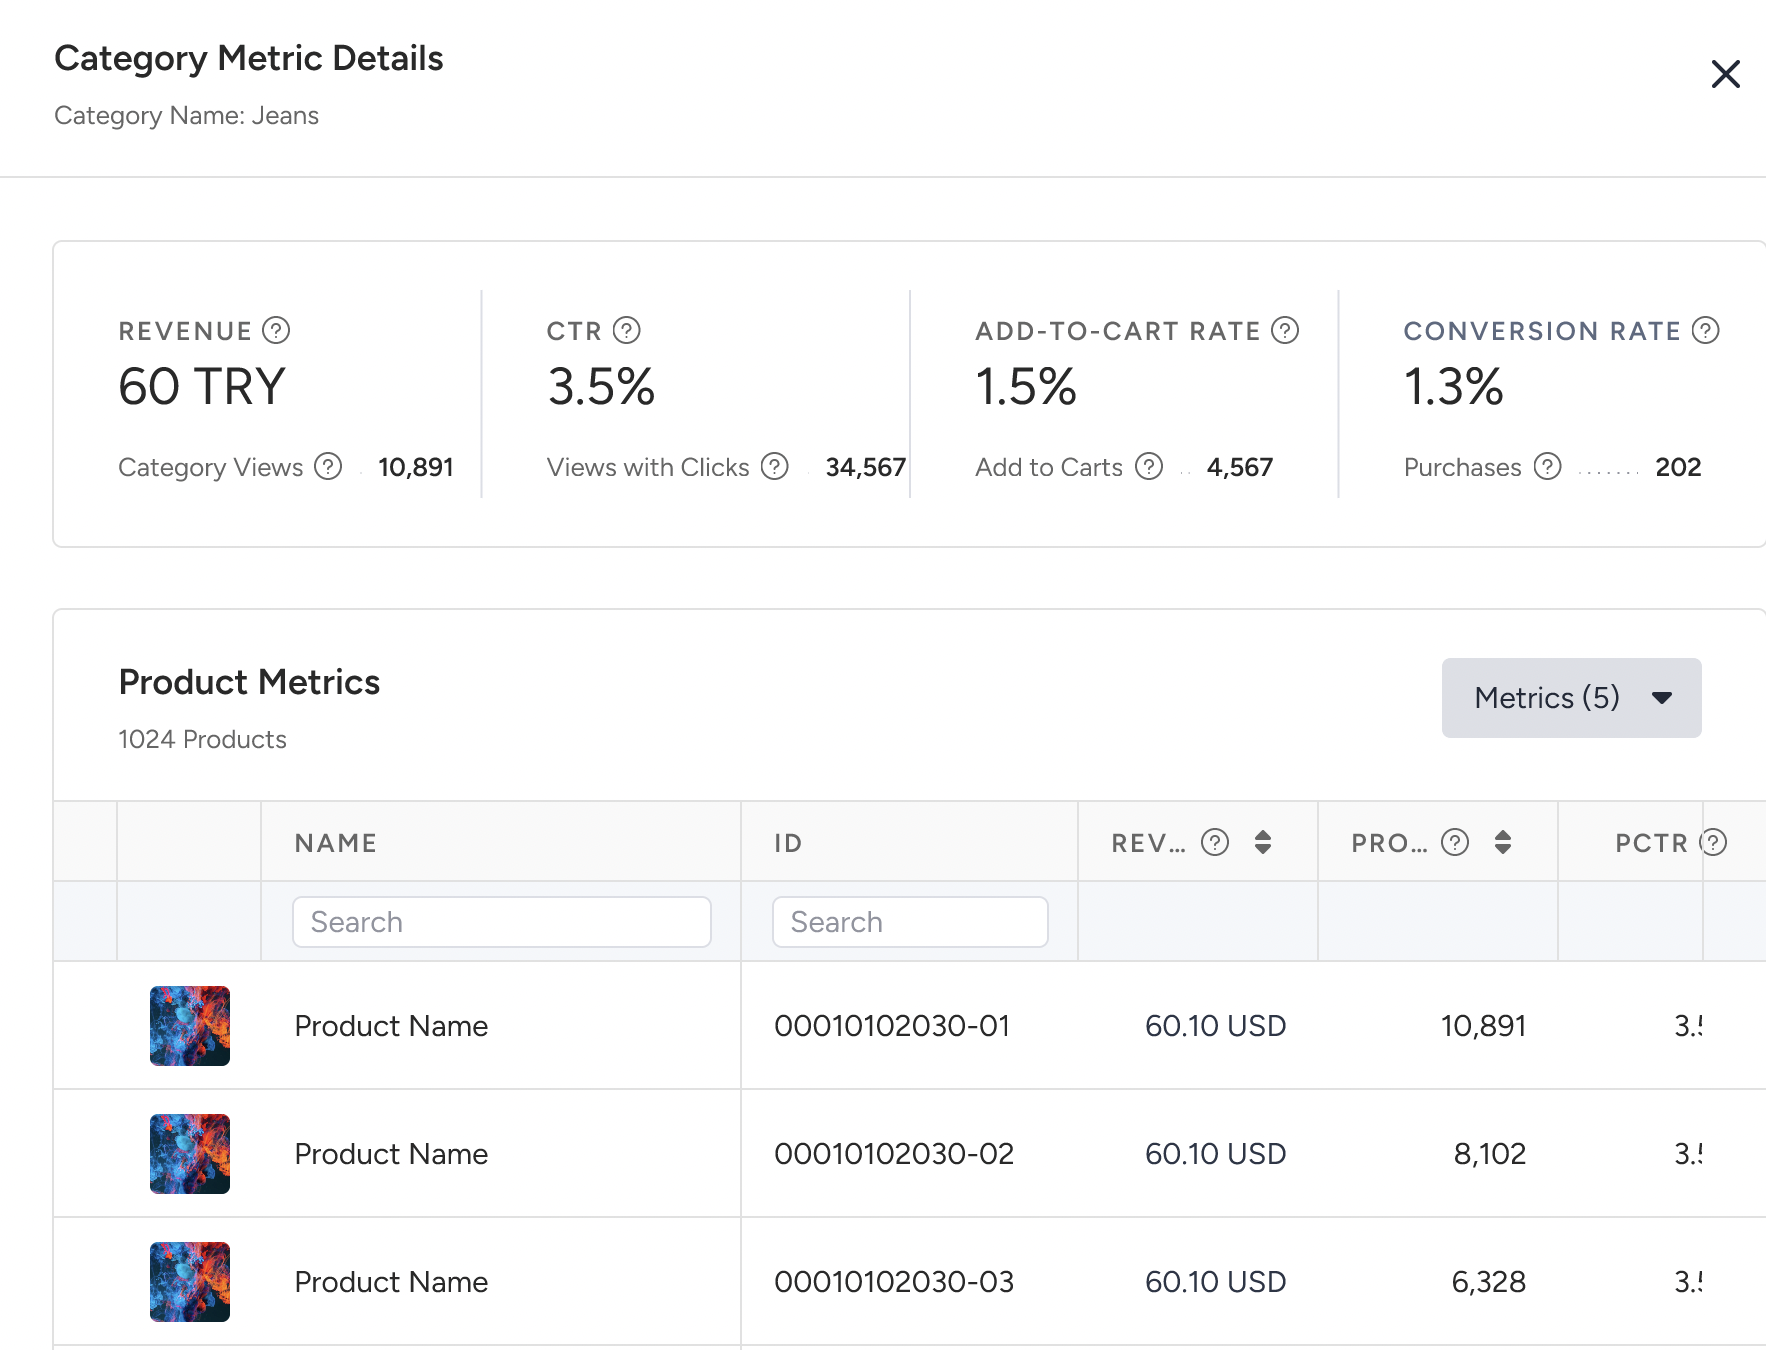
Category name
Category funnel metrics (scoped to this category only):
Category Views
CTR (with sub-metric Views with Clicks)
Add to Cart Rate (with sub-metric Add to Carts)
Conversion Rate (with sub-metric Purchases)
Category Revenue (with sub-metric Eureka Revenue)
Product table (products within the selected category): Each row represents a product’s performance inside that category:
Product Image
Product name
Product ID
Impressions
Clicks
CTR
Add to Cart Rate
Conversion Rate
You can use this modal to identify:
Products that drive most of the category’s performance.
Products with high impressions but low CTR or low conversion.
Campaign & Variant Metrics
This view lets you break category listing performance down by campaigns and their variants. Use it to answer questions like:
Which campaigns (and variants) drive the most purchases and revenue from category browsing?
Which variants get engagement but don’t convert?
Campaign and variant engagement performance
In the Category Analytics dashboard, open the Campaign / Variant performance table. You see that each row is a campaign. Clicking it expands nested rows for its variants.
Metrics reflect the Category view → Click → Add to cart / Purchase funnel within your selected attribution window.
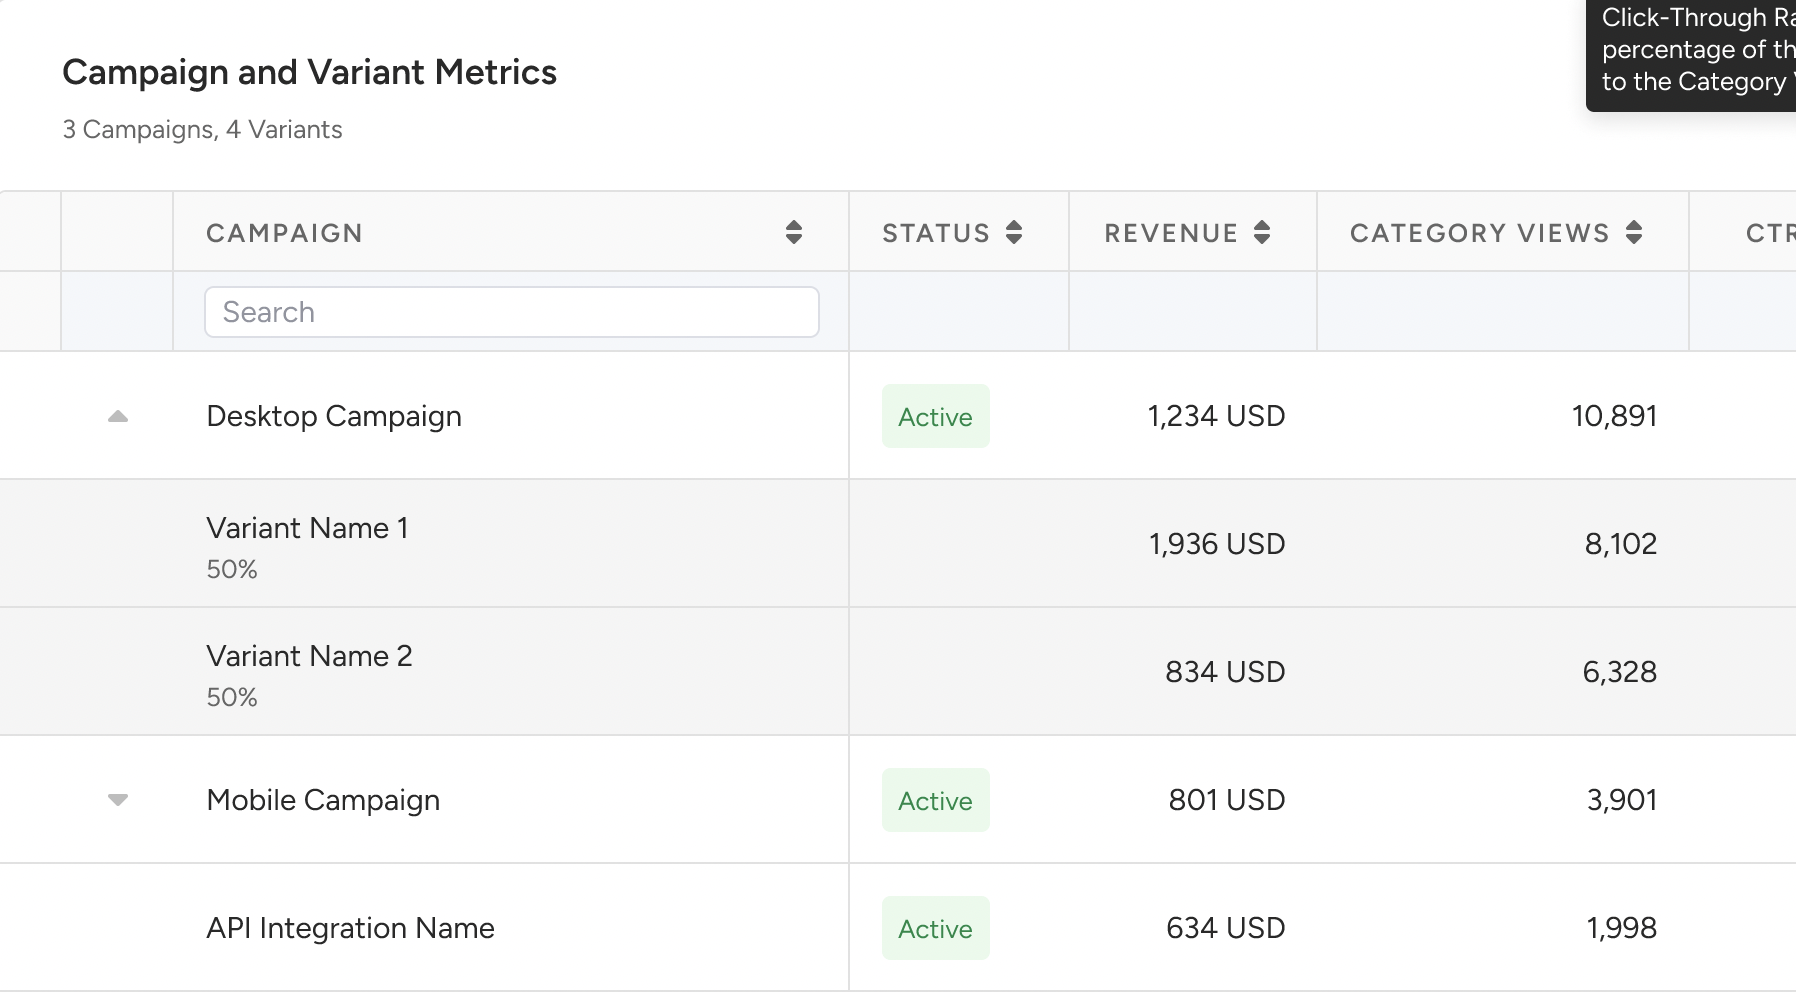
Metrics shown per campaign/variant (Availability may vary slightly by integration/type, but the metric logic is consistent):
Campaign name
Campaign Status
Integration Type
Platform
Revenue (attributed to category listing)
Category Views
Views with Clicks
Click-through Rate (CTR)
Add to Carts
Add to Cart Rate
Purchases
Conversion Rate
Total Clicks
Use this view to compare variants side-by-side and find variants that drive clicks but not purchases (or vice versa).
Product & Product Group Metrics
This view breaks down category listing performance at the product (SKU) and product group level, based on items customers discovered via category browsing.
Product engagement insights
You can find the product engagement insights in Product engagement tables (with tabs for Products and Product Groups) and view up to the top 10,000 engaged products, sorted by Revenue (descending).
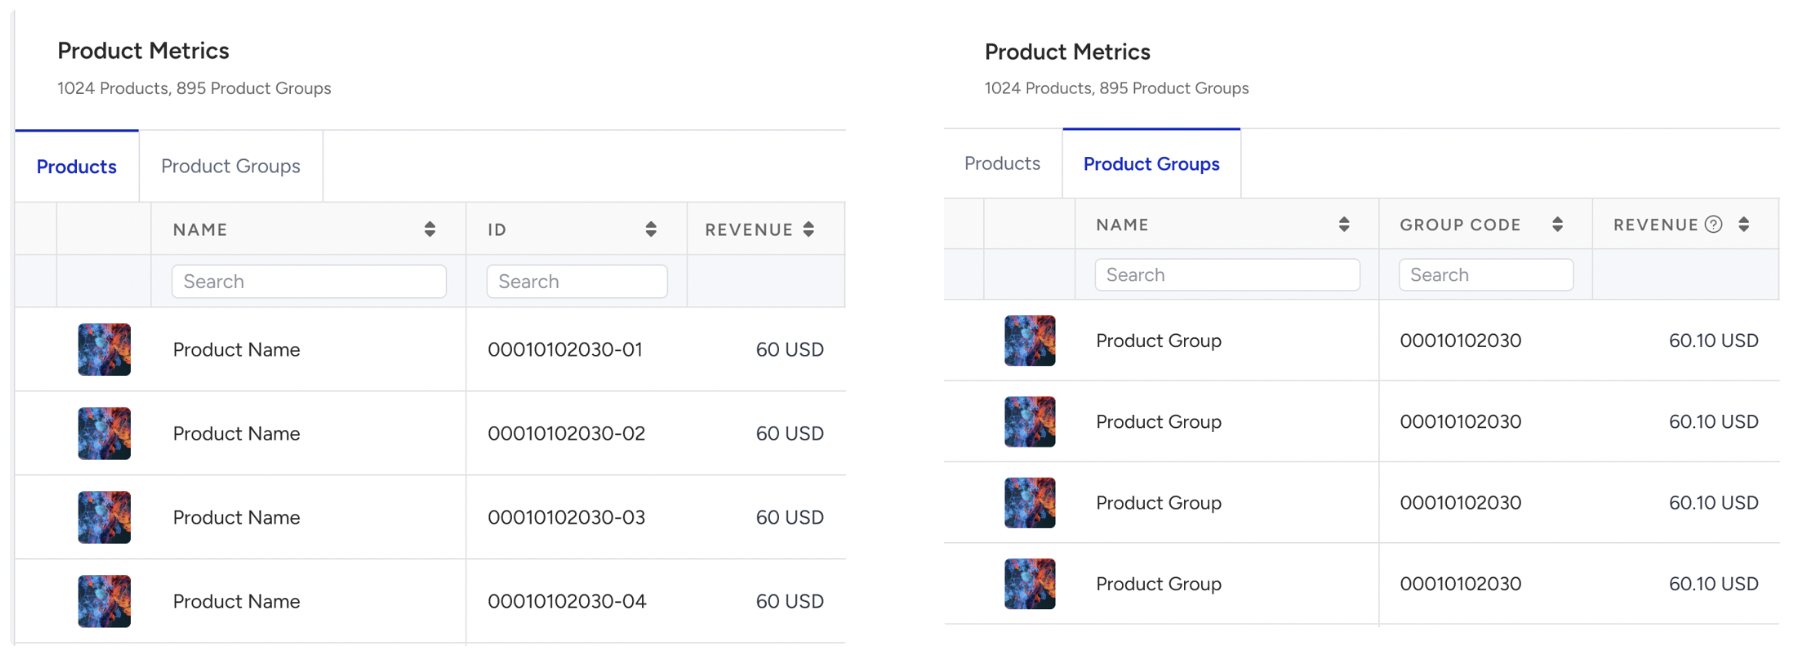
Products (per SKU)
Metrics use the same attribution rules explained earlier, but are broken down at the individual product level:
Product Image
Product Name
Product ID
Revenue (from purchases via category listing → click → purchase funnel)
Impressions: Number of times the product appeared in category listing views
Clicks
Click-through Rate (CTR) = Product clicks ÷ product impressions
Add to Carts
Add to Cart Rate = Product add-to-carts ÷ product impressions
Purchases
Conversion Rate = Product purchases ÷ product impressions
Product Groups (by group code)
These metrics are calculated the same way, but aggregated at the product group level (for example, different sizes/colors of the same product):
Product Image
Product Name
Group Code
Revenue
Impressions (sum of impressions across variants in the group)
Clicks
CTR = Group clicks ÷ group impressions
Add to Carts
Add to Cart Rate = Group add-to-carts ÷ group impressions
Purchases
Conversion Rate = Group purchases ÷ group impressions
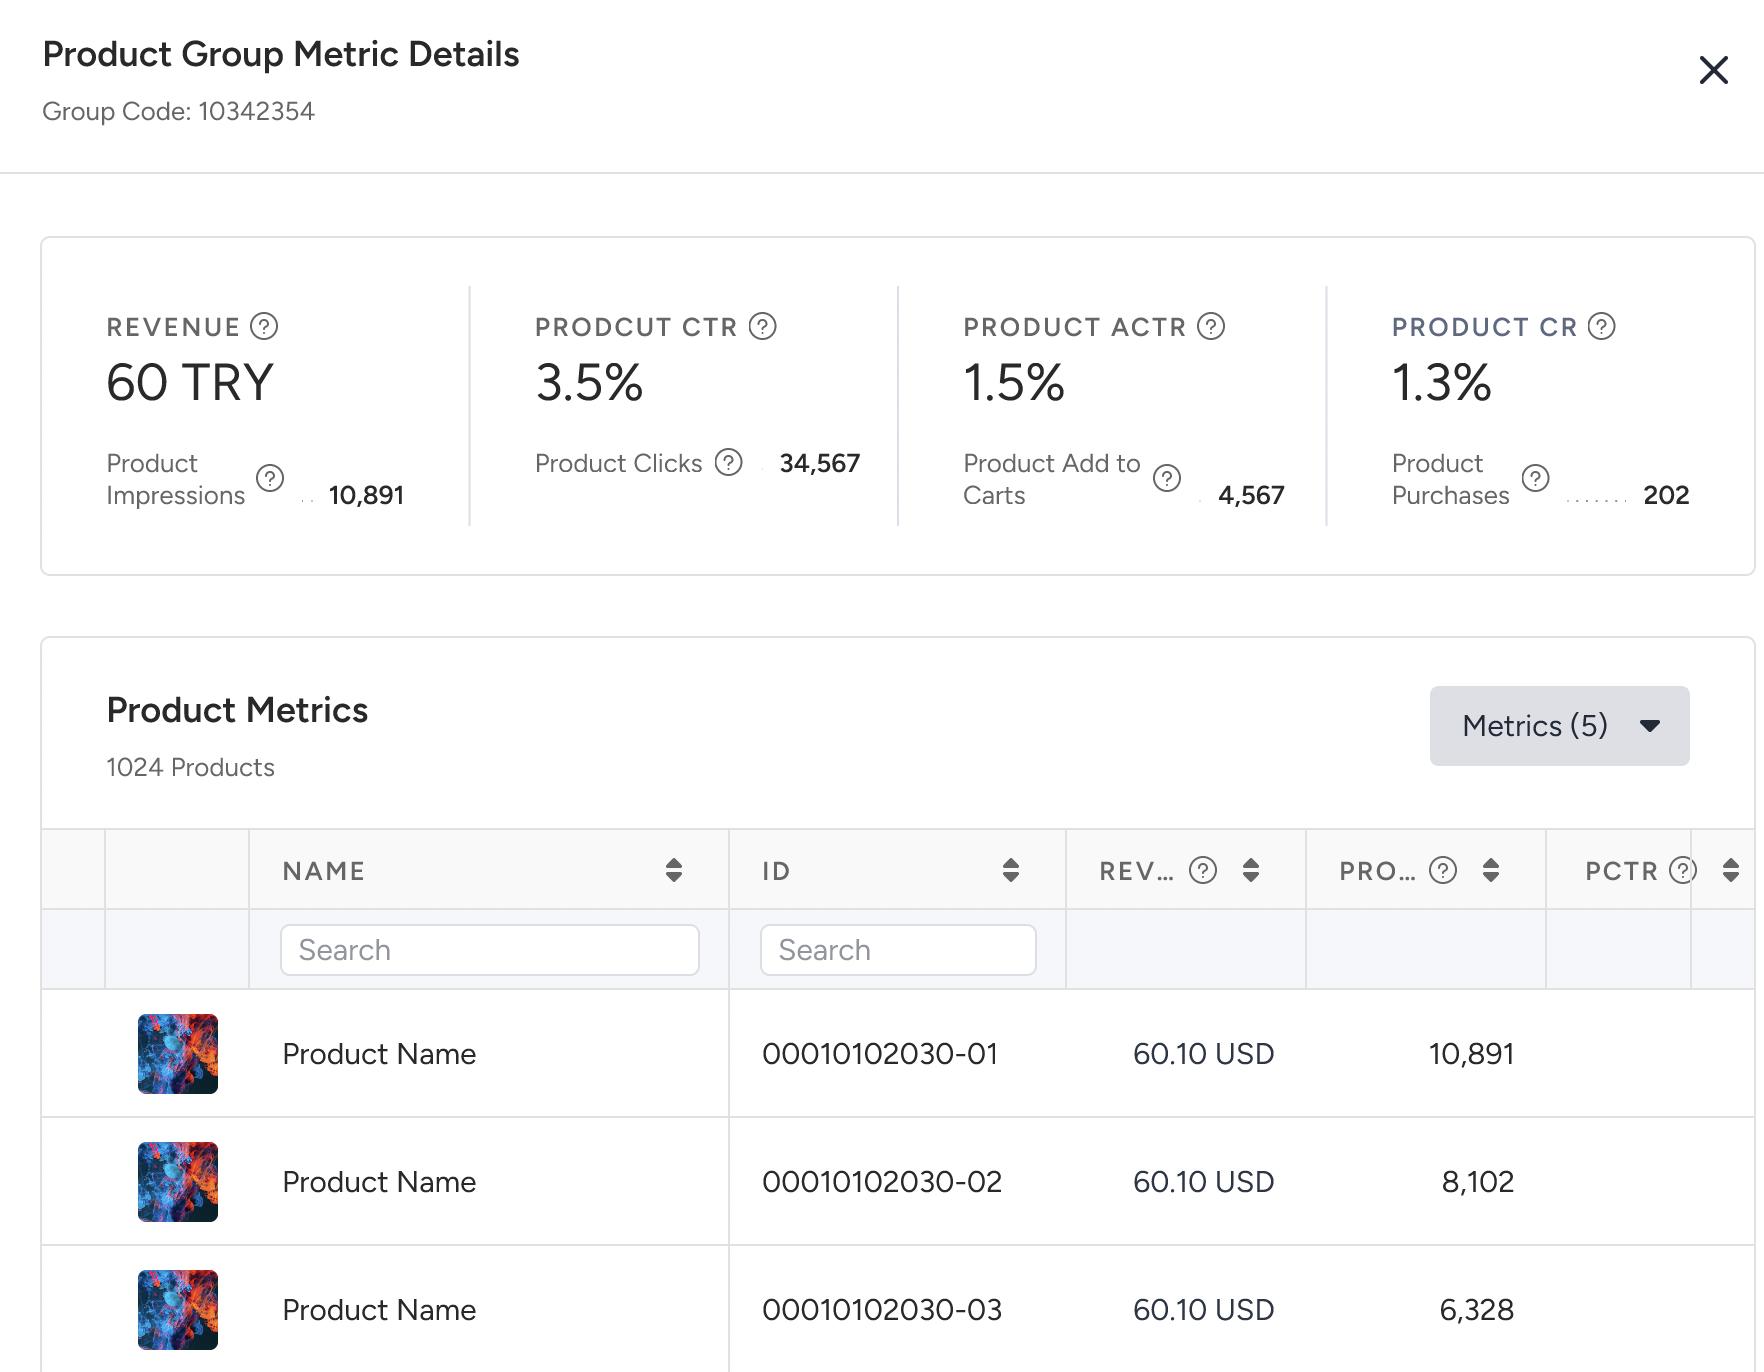
Product variant drill-down (product details)
Click the Info icon on a Product Group row to open a modal with SKU-level details for the products/variants in that group. The modal lists the metrics for each item so you can compare how different sizes and colors perform within the same product group. Each row shows the performance of an individual variant in the group:
Export your results
The Export button lets you export all analytics data into a spreadsheet. The export reflects all filters currently applied (date range, attribution window, locales, integrations, platforms).
To access your results, click the Export button in the dashboard; a new tab will open, allowing you to download the file.
Best practices
Choose an attribution window that matches your buying cycle (fast purchases: Same Session / 1 Day; longer consideration: 7–30–90 Days).
If CTR is low, improve category relevance and engagement: update sorting, facet strategy, featured items, product imagery/titles, and availability.
If CTR is strong but Purchases (and Conversion Rate) are low, review pricing, shipping, PDP content, and product quality.
Compare platforms/locales to find UX or catalog gaps.
Use Product Groups to understand how different variants (size, color, etc.) perform.
Integration & log collection
Category Listing Analytics is supported via:
Event collection via JS SDK
To calculate the category funnel, your implementation needs to track:
Category View
Product Click (from category listing)
Add to Cart
Purchase
For further information, refer to Eureka SDK Log Collection Methods.
Troubleshooting (common issues + fixes)
Purchases or revenue missing
Check the attribution window; purchases outside the window are not attributed.
Verify product group codes for variants so that variant purchases are correctly matched.
Verify the full event chain exists: category view → product click → add-to-cart/purchase.
CTR seems low
Remember that facet, sort, and pagination actions generate additional category views, increasing the denominator.
Exported spreadsheet shows fewer rows than expected
Exports respect the active filters (date range, attribution window, locales, integration types, platforms). Try broadening filters, then export again.