A/B testing within Smart Recommender lets you compare the performance of different recommendation strategies, design elements, or placements. It ensures that your decisions are backed by data, helping you continuously optimize user experience and campaign results.
When to use A/B Testing
Use A/B testing to:
Compare recommendation strategies – Test two or more algorithms with different configurations.
Optimize design and placement – Experiment with different layouts, UI flows, or widget placements on your site.
Validate new strategies – Run smaller-scale tests before deploying a new approach across your entire audience.
How A/B Testing Works in Smart Recommender
Smart Recommender simplifies A/B testing by:
Splitting traffic automatically – Users are divided into groups based on the test percentages you set.
Presenting variants – Each group sees different strategies, designs, or placements.
Tracking results – Metrics are measured per variant, allowing you to compare performance side by side.
This process helps you quickly identify which option performs best and scale it confidently.
Step-by-step: Set up an A/B Test
Step 1: Define your objective
Before setting up an A/B test, clarify what you want to achieve. A well-defined objective ensures your test is measurable, targeted, and aligned with business goals.
Decide what to test
Identify the specific element you want to compare. Examples include: widget placements, carousel designs, recommendation algorithms, and recommendation strategies.
Define test pages
Select the page(s) on which the test will run. Be precise—for example, homepage, product detail page, or cart page.
Choose your primary KPI
Decide which metric will be used to measure success. Common KPIs include Click-through rate (CTR), Conversion rate, and Revenue per user.
Step 2: Create your campaign
Start a new campaign
Navigate to Web Smart Recommender and click Create.
Give your campaign a clear, descriptive name (e.g., “Cross-sell A/B on Product Pages”).
Define audience and rules
Segments step: Select the target audience for your test.
Rules step: Set conditions for when the campaign should trigger.
Configure variants
On the Design step:
A control group is added by default.
Click Add a New Variant for each additional strategy.
Name variants clearly (e.g., A: Cross-Sell Perfumes, B: Cross-Sell Deodorants).
Assign the correct strategy to each variant.
Define the traffic split (e.g., 50
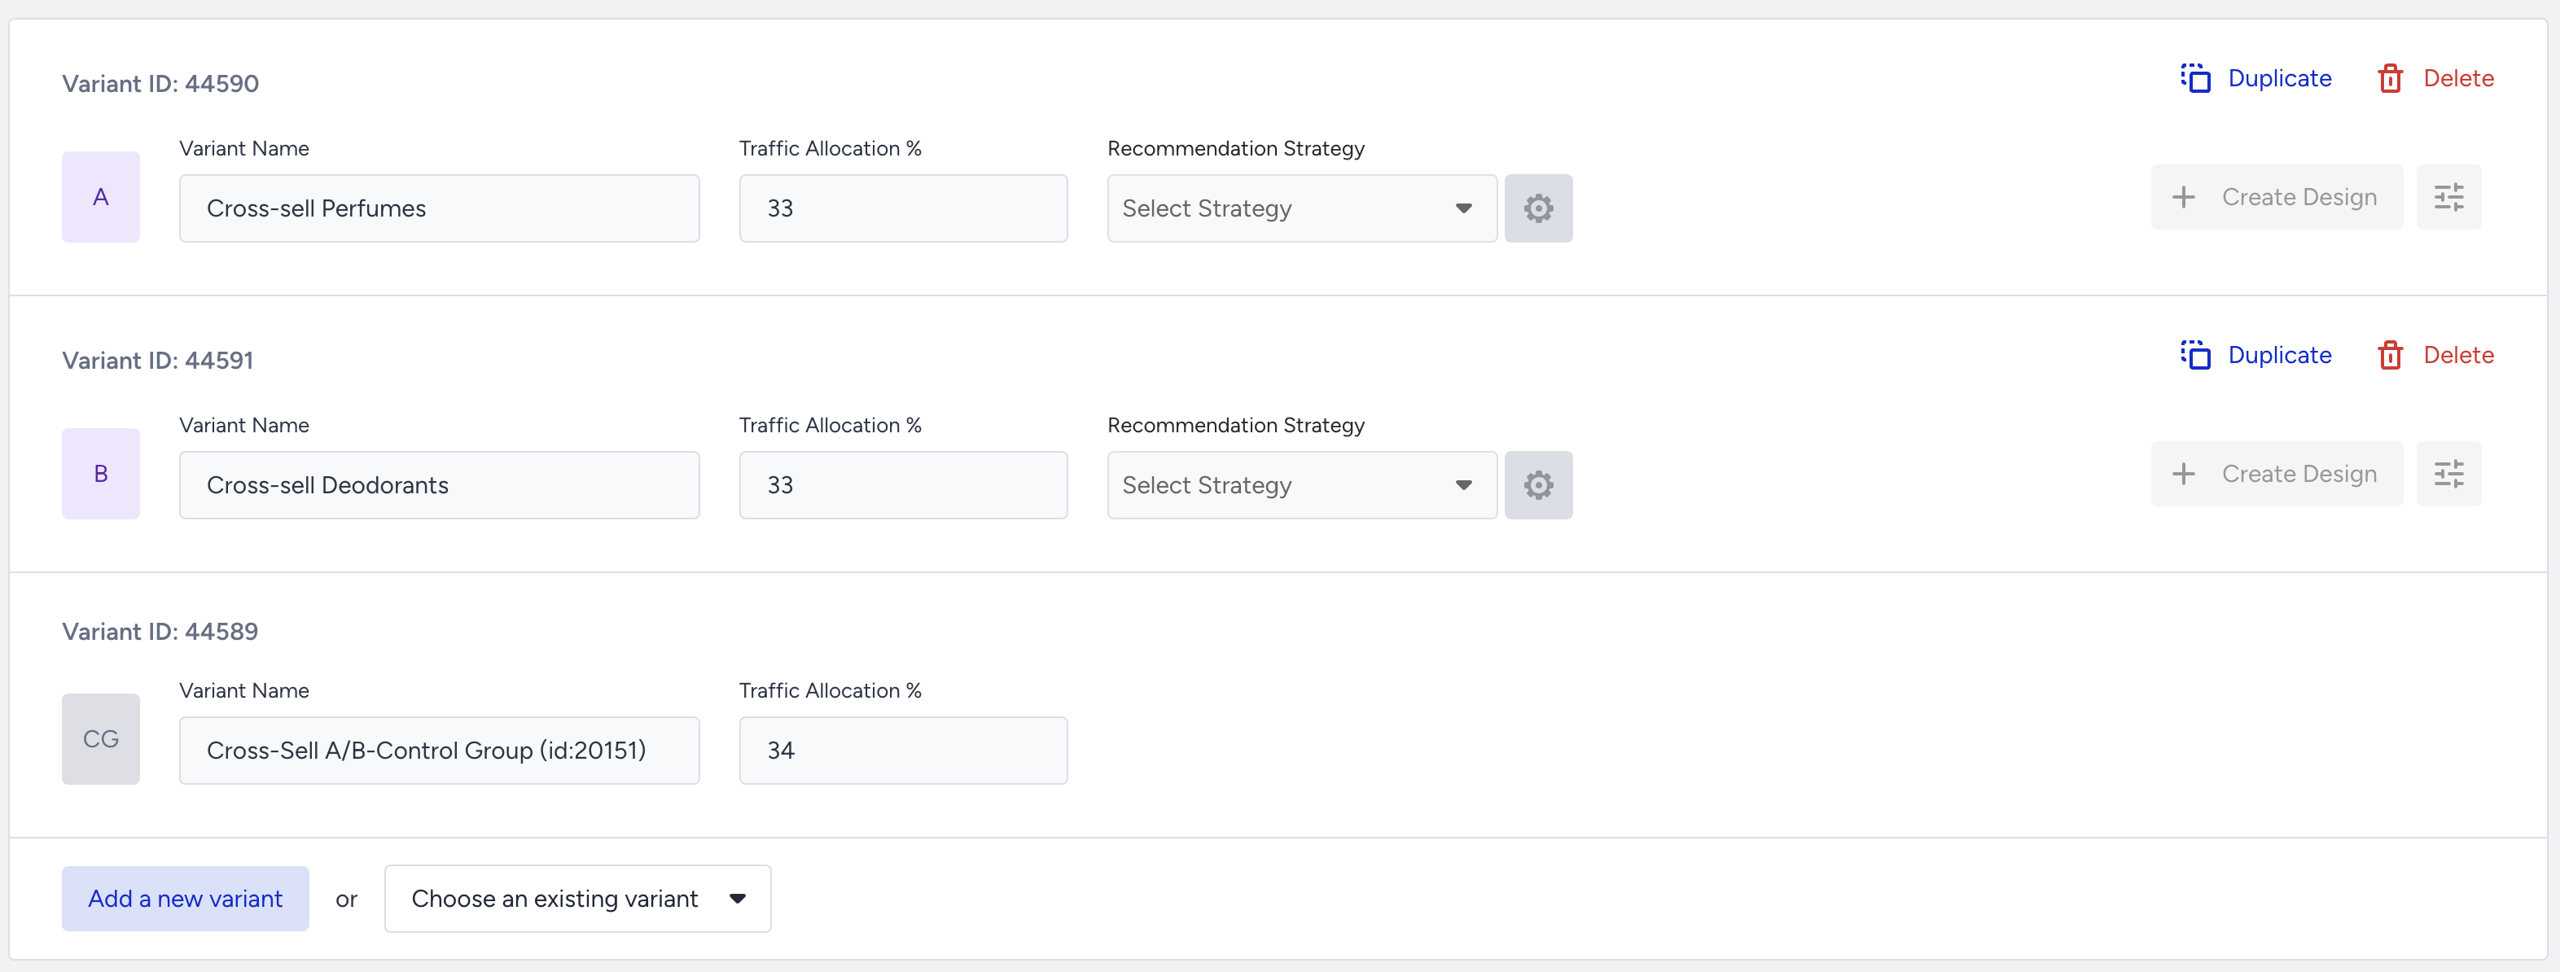
Define Goals
On the Goals step, select what you want to track.
Choose from default goals (CTR, conversion, revenue) or create a custom goal aligned with your test objective.
Set test duration
On the Launch step, configure your Activation Time to define how long the test will run.

Step 3: Monitor your results
Access Analytics
Navigate to the Smart Recommender Analytics page.
Select the relevant date range for your test.
Locate your campaign
Find your campaign under the Campaign and Variant Metrics table.
Click the campaign name to open detailed results.
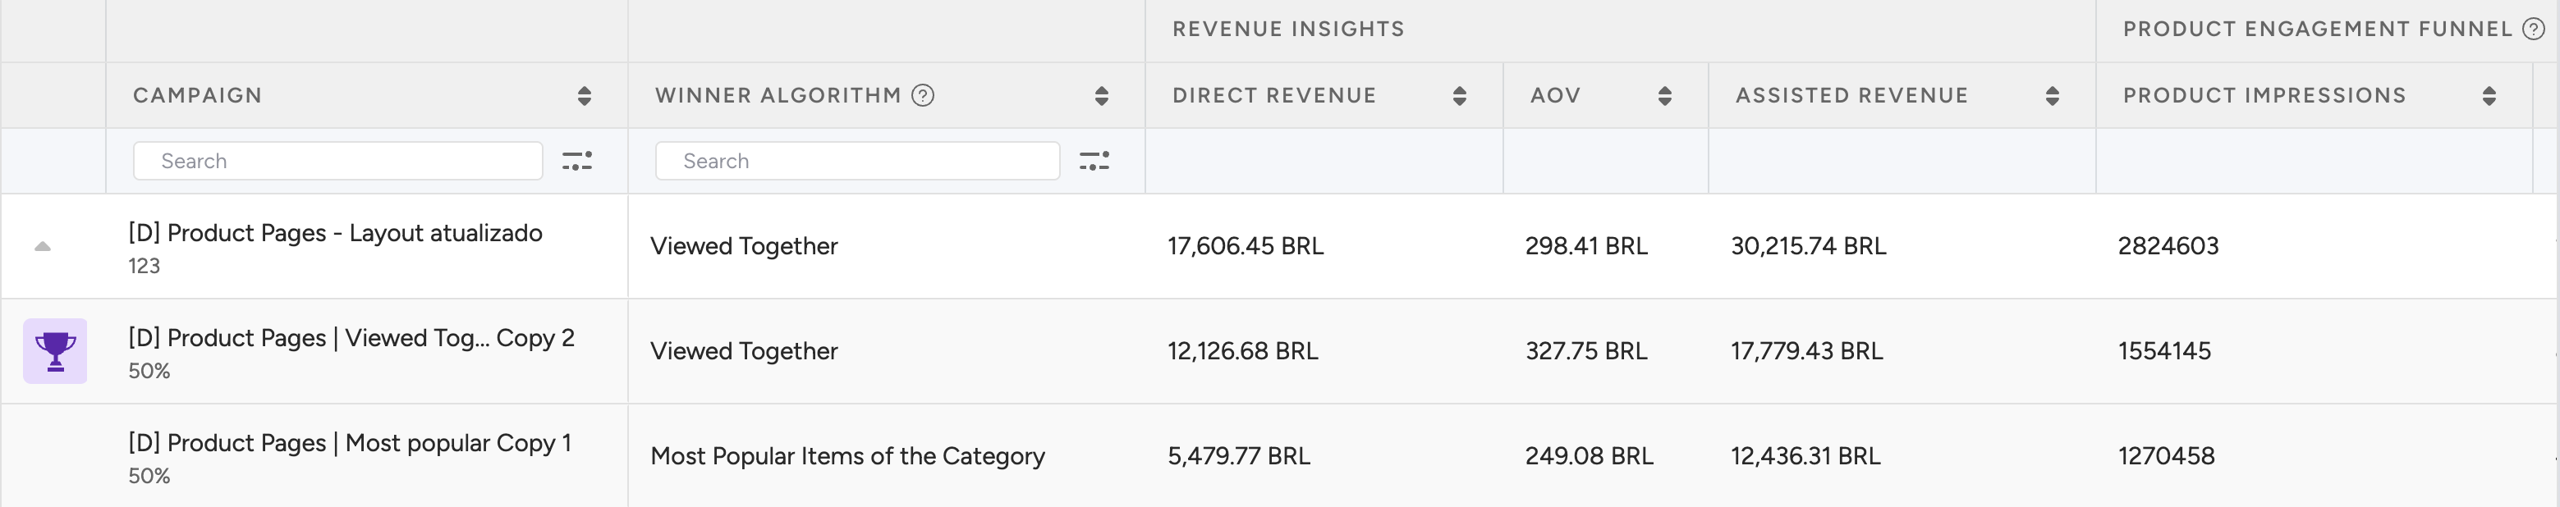
Review metrics
First row: Shows the total metrics of your campaign.
Second row: Displays performance metrics for Variant A.
Third row: Displays performance metrics for Variant B.
Identify the winning variant
Look for the purple trophy icon — this marks the best-performing variant in your test.
Interpret the results
What the purple trophy means
The purple trophy icon highlights the variant with the best performance.
By default, Smart Recommender prioritizes Direct Revenue as the key success metric.
If no direct revenue is recorded, it falls back to Click-Through Rate (CTR).
If CTR is also equal, it uses Impressions to determine the winner.
Focus on your campaign goal
Do not rely on a single default metric. Always evaluate your results against the goal of your A/B test:
Visibility goal (e.g., testing widget placement):
Compare Impressions to see which variant was displayed more frequently to users.
Engagement goal (e.g., testing product discovery algorithms):
Compare Click-Through Rates to identify which variant drove more interaction.
Revenue goal (e.g., testing recommendation strategies for conversions):
Compare Direct Revenue to measure which variant contributed more to purchases.
For deeper analysis, refer to the How to Interpret Analytics Results guide. This will help you combine multiple metrics for a holistic view of performance.
Best Practices for A/B Testing in Smart Recommender
Test one variable at a time
Change only one factor per test (e.g., recommendation strategy, widget placement, or design).
Testing multiple changes simultaneously creates confounding results and makes it impossible to determine which variable impacted performance.
Run the test long enough
Allow tests to run until you have statistically significant data.
Minimum recommended duration: seven days, to capture weekday vs. weekend user behavior.
Ensure you reach a sufficient sample size—check impression counts to confirm that you have enough data to make a confident decision.
Align tests with business goals
Define your primary KPI before starting the test.
Evaluate variants against the KPI that reflects your business objective.
If your goal is revenue growth, measure Direct Revenue.
If your goal is engagement, measure CTR.
Avoid optimizing for the wrong metric (e.g., clicks when the goal is revenue).
Don’t pause tests too early
Avoid stopping a test before it completes the required duration.
Early fluctuations are often random noise and can lead to misleading conclusions.
Combine with segmentation
Test across different user groups for deeper insights:
Device types: Mobile vs. Desktop
User types: New vs. Returning users
Segmentation reveals performance differences that may be hidden in overall results.
Common A/B Test Examples
All Pages
Global recommendation components (such as floating widgets or homepage banners) reach a broad audience. Running A/B tests across all pages allows you to discover which strategies, designs, or placements work best across your entire site or specific audience segments.
Example Scenarios
Widget Design: Compare different design approaches (e.g., image-focused vs. text-rich layouts) to see which attracts more engagement.
Widget Placement: Test placing the same widget in different areas (e.g., top vs. sidebar) and measure impression counts to determine the most effective location.
Personalization vs. Non-Personalization: Compare personalized recommendation algorithms against static or generic recommendations for returning users. Measure CTR to evaluate which approach resonates more with your audience.
Product Pages
Product detail pages are critical for driving conversions. A/B testing on these pages helps you determine which recommendation logic, layout, or presentation style increases add-to-cart actions and encourages users to explore more products.
Example Scenarios
Algorithm Comparison: Test different recommendation algorithms, such as Viewed Together vs. Complementary Products, to see which drives higher add-to-cart rates.
Recommendation Titles: Experiment with titles like “You May Also Like” vs. “Customers Also Bought” to assess which wording improves user trust and engagement.
Product Density: Compare layouts with five recommended items vs. 10 to evaluate whether a compact or extensive recommendation set better supports conversions.
Cross-Sell Strategies: Apply different cross-sell category filters (e.g., accessories vs. substitutes) to test which categories generate the most incremental sales. Monitor conversion rates to measure success.
Category Pages
Category pages are high-traffic hubs for product discovery and exploration. A/B testing on these pages helps you refine merchandising decisions, highlight the right products, and improve overall user navigation within a category.
Example Scenarios
New Arrivals vs. Discounted Items: Compare the New Arrivals algorithm against the Highest Discounted algorithm to evaluate which approach drives more user engagement on category pages.
Top Sellers vs. Personalized Picks: Test Top Sellers (category-specific bestsellers) against User-Based Recommendations (personalized picks).
Monitor Click-Through Rate (CTR) to see which algorithm attracts more initial interest.
Track Conversion Rate to identify which one leads to more purchases.
Cart Pages
Cart pages are critical touchpoints for increasing Average Order Value (AOV) and minimizing cart abandonment. A/B testing here helps identify which recommendation strategies, placements, or messaging drive the highest upsell and checkout conversions.
Example Scenarios
Recommendation Algorithm Test: Compare Checkout Recommendation vs Purchased Together algorithms to measure which one contributes more to AOV uplift.
Messaging Strategy Test: Test urgency messaging (e.g., “Hurry, limited stock!”) against value-driven messaging (e.g., “Perfect pairings for your cart”). Monitor which approach increases add-to-cart actions or checkout progression.
Widget Placement Test: Place recommendation widgets above the cart summary vs near the promo code input. Compare add-to-cart rates to identify the most impactful placement.
Next steps after a test
Roll Out Winning Variants: Apply the winning algorithm, design, or placement to your whole audience.
Iterate with Follow-up Tests: Launch a new A/B test with additional variants to refine and build on prior learnings.
Leverage Insights Across Campaigns: Apply successful strategies from cart tests to other touchpoints (e.g., product pages, category pages, checkout).